 뒤로
뒤로Introduction to the Practice of Statistics: Key Concepts and Data Types
스터디 가이드 - 스마트 노트
 자료에 맞춘 맞춤형 노트, 핵심 정의, 예시, 맥락을 확장해 제공합니다.
Section 1.1 – Introduction to the Practice of Statistics
What is Statistics?
Statistics is the science of collecting, organizing, summarizing, and analyzing information to draw conclusions or answer questions. It also involves providing a measure of confidence in any conclusions drawn from data.
Example: A community college surveys 128 randomly selected students to determine how many hours per week they work. The average number of hours worked is 25.
Key Terms in Statistics
Data: Information collected for analysis. It can be facts or propositions used to draw conclusions or make decisions, and it describes characteristics of individuals. Data can vary.
Population: The entire group of individuals to be studied.
Individual: A single member or object from the population being studied.
Sample: A subset of the population selected for study.
Statistic: A numerical summary calculated from a sample.
Parameter: A numerical summary describing a population.
Descriptive Statistic: Methods for organizing and summarizing data, often using numerical summaries, tables, and graphs.
Inferential Statistic: Methods that use sample data to make generalizations about a population and measure the reliability of the results.
Examples: Parameter vs. Statistic
Parameter: The average score for a class of 30 students (entire population) is 75%.
Statistic: 13.5% of Americans age 12 and over (sample) used drugs in the last month.
Variables and Types of Data
Variables
Variables are characteristics or attributes of individuals within a population that can change or vary.
Qualitative vs. Quantitative Variables
Qualitative Variables (Categorical): Classify individuals based on attributes or characteristics (e.g., educational level, gender, marital status, name, ID number).
Quantitative Variables: Provide numerical measures of individuals. These values can be added or subtracted to yield meaningful results (e.g., GPA, bank account balance, salaries, number of followers).
Examples: Qualitative vs. Quantitative
Gender: Qualitative
Temperature: Quantitative
Number of days a student studied: Quantitative
Zip code: Qualitative
Discrete vs. Continuous Variables
Discrete Variables: Quantitative variables with a finite or countable number of possible values. If you count to obtain the value, it is discrete.
Continuous Variables: Quantitative variables with an infinite number of possible values. If you measure to obtain the value, it is continuous.
Examples: Discrete vs. Continuous
Number of tails in four coin flips: Discrete
Number of cars at a drive-through between 9 PM and 10 PM: Discrete
Distance a car can travel on a full tank: Continuous
Levels of Measurement of a Variable
Variables can be classified by their level of measurement, which determines the type of statistical analysis that is appropriate.
Nominal Level: Values name, label, or categorize. No inherent order. Examples: Blood type, eye color.
Ordinal Level: Values can be ranked or ordered, but differences between values are not meaningful. Examples: Socio-economic status, satisfaction ratings.
Interval Level: Values can be ordered, and meaningful differences exist, but zero does not indicate absence of quantity. Examples: Temperature, credit scores.
Ratio Level: Values can be ordered, meaningful differences and ratios exist, and zero indicates absence of quantity. Examples: Money, weight.
Examples: Levels of Measurement
Gender: Nominal
SAT score: Interval
Number of days a student worked out last week: Ratio
Letter grade: Ordinal
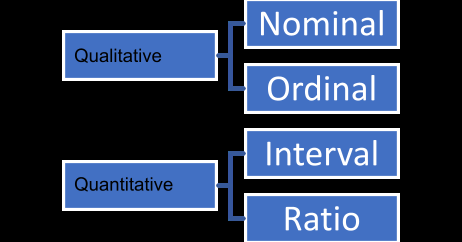
Additional info: The diagram visually summarizes how qualitative variables are associated with nominal and ordinal levels, while quantitative variables are associated with interval and ratio levels.
