 뒤로
뒤로Introductory Statistics Ch. 1: Gathering and Classifying Data
스터디 가이드 - 스마트 노트
 자료에 맞춘 맞춤형 노트, 핵심 정의, 예시, 맥락을 확장해 제공합니다.
Introduction to Statistics
What is Statistics?
Statistics is the science of collecting, organizing, analyzing, and interpreting data. Data are collections of observations, such as measurements, genders, survey responses, or counts. Statistics is essential for making informed decisions and understanding the world, but it is important to recognize that data can be misused or presented in misleading ways.
Statistics: The science (or mathematics) of data.
Data: Collections of observations.
Statistics helps organize and analyze data to draw meaningful conclusions.
Data Sources and Types of Studies
Types of Studies
There are several ways to collect data, each with its own strengths and limitations. Understanding the type of study is crucial for interpreting results correctly.
Cross-sectional study: Data are observed, measured, and collected at one point in time.
Retrospective study: Data are collected from the past, often through records or interviews.
Prospective (cohort) study: Data are collected in the future from groups (cohorts) sharing common factors.

Gathering Data
Population and Sample
When conducting a statistical study, it is important to distinguish between the population and the sample.
Population: The complete collection of all data that are of interest (everyone or everything you want to learn about).
Census: The collection of data from every member of a population.
Sample: A subset of the population, selected for analysis.
Examples of Populations and Samples
Survey of 360 North Carolina students: Population is all North Carolina students; Sample is the 360 surveyed.
Survey of 3002 US adults about internet news: Population is all US adults; Sample is the 3002 surveyed.
Sampling Methods
Types of Sampling
Sampling methods are strategies used to select a subset of individuals from a population. The goal is to obtain a sample that accurately represents the population.
Simple Random Sample: Every possible sample of size n has the same chance of being chosen. Example: Drawing names from a hat.
Systematic Sample: Select every kth individual from a list after a random start.
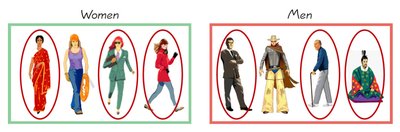
Stratified Sample: Divide the population into subgroups (strata) based on a characteristic, then randomly sample from each stratum.
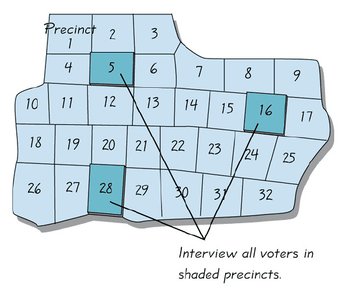
Cluster Sample: Divide the population into clusters, randomly select some clusters, and include all members from those clusters.

Random Selection
Random selection is a key principle in sampling, ensuring that every individual has an equal chance of being chosen. Randomness helps reduce bias and increases the likelihood that the sample represents the population.
Good Sampling Practices
The sample should be an accurate representation of the population.
Randomness and sufficient sample size are essential for good sampling.
Poor sampling methods can lead to misleading results.
Parameters and Statistics
Definitions
Parameter: A numerical measurement describing some characteristic of a population.
Statistic: A numerical measurement describing some characteristic of a sample.
Example: If 5% of all adults in a country have a body piercing, 5% is a parameter. If 5% of a sample of 2320 adults have a body piercing, 5% is a statistic.
Classifying Data
Categorical vs. Quantitative Data
Data can be classified as categorical or quantitative:
Categorical (Qualitative) Data: Names or labels that do not represent counts or measurements (e.g., eye color, gender).
Quantitative Data: Numbers representing counts or measurements (e.g., height, weight, age).

Discrete vs. Continuous Data
Quantitative data can be further classified as discrete or continuous:
Discrete Data: Values are separate and distinct (e.g., number of cars, shoe sizes).
Continuous Data: Infinitely many possible values within a range (e.g., height, distance).

Levels of Measurement
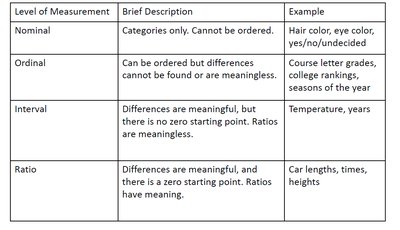
Data can be measured at different levels, which determine the types of statistical analyses that are appropriate.
Level of Measurement | Brief Description | Example |
|---|---|---|
Nominal | Categories only. Cannot be ordered. | Hair color, eye color, yes/no/undecided |
Ordinal | Can be ordered but differences cannot be found or are meaningless. | Course letter grades, college rankings, seasons of the year |
Interval | Differences are meaningful, but there is no zero starting point. Ratios are meaningless. | Temperature, years |
Ratio | Differences are meaningful, and there is a zero starting point. Ratios have meaning. | Car lengths, times, heights |
Bias in Data Collection
What is Bias?
Bias is a systematic error that results in an incorrect estimate of a population characteristic. It can be intentional or unintentional and should be minimized to ensure accurate results.
Sampling Bias: Some subjects have a higher probability of being selected, making the sample less representative.
Self-Interest Bias: Research sponsored by interested parties may underreport or omit undesirable results.
Leading Question Bias: Questions are worded to influence responses.
Nonresponse Bias: Certain groups are less likely to respond, skewing results.
Confirmation Bias: Tendency to search for or interpret information in a way that confirms one's preconceptions.
Anecdotal Evidence
Definition and Limitations
Anecdotal evidence is based on personal stories or isolated examples rather than systematic data collection. While anecdotes can be compelling, they are not reliable for drawing scientific conclusions because they may not represent the broader population.
Summary Table: Types of Studies and Sampling Methods
Study Type | Description | Example |
|---|---|---|
Cross-sectional | Data collected at one point in time | Survey of students' cell phone use today |
Retrospective | Data collected from past records | Reviewing medical records from last year |
Prospective (Cohort) | Data collected in the future from groups sharing common factors | Following a group of smokers for 10 years |
Sampling Method | Description | Example |
|---|---|---|
Simple Random | Every sample has equal chance | Drawing names from a hat |
Systematic | Select every kth individual | Every 10th person on a list |
Stratified | Divide into strata, sample from each | Sample from each grade level |
Cluster | Divide into clusters, sample all in some clusters | Sample all students in selected classrooms |
