 뒤로
뒤로Measures of Center in Statistics: Mean, Median, and Mode
스터디 가이드 - 스마트 노트
 자료에 맞춘 맞춤형 노트, 핵심 정의, 예시, 맥락을 확장해 제공합니다.
Measures of Center
Introduction to Measures of Center
Measures of center are statistical values that describe a typical or central value for a data set. The three most common measures are the mean, median, and mode. Each measure provides a different perspective on the data and is appropriate in different contexts.
Mean
Sample Mean
The sample mean is the arithmetic average of a set of data values. It is calculated by summing all the data values and dividing by the number of values in the sample.
Formula: where is the ith data value and is the number of data values.
Example: For the data set 5, 6, 8, 10, 4, 6, 9, the mean is
Application: The mean is sensitive to outliers and skewed data.
Using the Mean to Find a Data Value
Example: If the mean cost of five songs is
Weighted Mean
The weighted mean is used when different data values contribute unequally to the overall mean. Each value is multiplied by a weight representing its relative importance.
Formula: where is the ith data value and is its weight.
Example: If a final grade is based on tests (40%), homework (20%), quizzes (10%), and a final exam (30%), and the scores are 83, 98, 90, and 87, respectively:
Median
Finding the Median of a Data Set
The median is the middle value when the data are ordered. It divides the data set into two equal halves.
Order the data from smallest to largest.
If the number of values () is odd, the median is the middle value.
If is even, the median is the mean of the two middle values.
Example: For the data set 3, 4, 6, 7, 2, 8, 9 (ordered: 2, 3, 4, 6, 7, 8, 9), the median is 6.
Mode
Definition of Mode
The mode is the value that appears most frequently in a data set. A data set may have one mode (unimodal), two modes (bimodal), or more (multimodal). If all values occur with the same frequency, there is no mode.
Example: For the data set 6, 4, 6, 1, 7, 8, 7, 2, 5, 7, the mode is 7 (appears most often).
Choosing an Appropriate Measure of Center
Guidelines for Choosing a Measure of Center
For qualitative data, use the mode.
For quantitative data without outliers or skewness, use the mean.
For quantitative data with outliers or skewness, use the median.
Example:
T-shirt sizes (S, M, L, XL): Use mode.
Salaries for a professional baseball team: Use median (due to outliers).
Prices of homes in a subdivision of similar homes: Use mean.
Professor rankings (best, average, worst): Use mode.
Graphs and Measures of Center
Relationship Between Graphs and Measures of Center
The mode is at the highest peak of the distribution.
The median divides the area under the distribution in half.
The mean is pulled toward outliers and the tail in a skewed distribution.
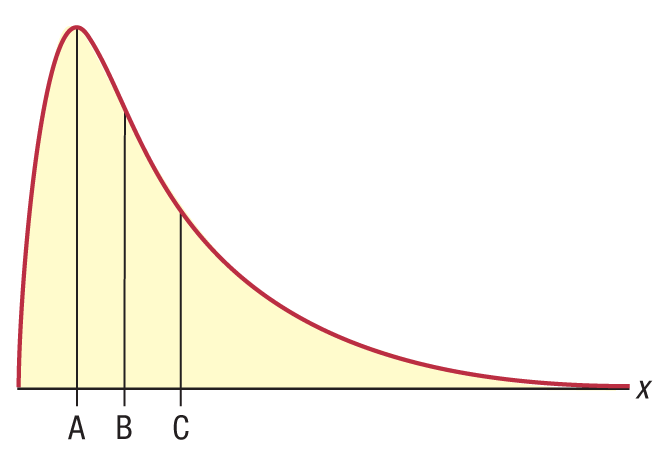
In a right-skewed distribution (as shown above):
Line A: Mode (at the peak)
Line B: Median (divides area in half)
Line C: Mean (pulled toward the right tail)
Table: Properties of Mean, Median, and Mode
Measure | Definition | Best Used For | Sensitivity to Outliers |
|---|---|---|---|
Mean | Arithmetic average of all data values | Quantitative data without outliers | Highly sensitive |
Median | Middle value when data are ordered | Quantitative data with outliers or skewness | Not sensitive |
Mode | Most frequently occurring value | Qualitative or categorical data | Not sensitive |
