 뒤로
뒤로L8 Normal Probability Distribution: Concepts, Calculations, and Applications
스터디 가이드 - 스마트 노트
 자료에 맞춘 맞춤형 노트, 핵심 정의, 예시, 맥락을 확장해 제공합니다.
Normal Probability Distribution
Continuous Random Variables
Continuous random variables are variables that can take any real value within a given interval. Unlike discrete random variables, their possible values cannot be listed individually, as there are infinitely many within any range.
Definition: A continuous random variable is one whose set of possible values forms an interval or collection of intervals on the real number line.
Examples: Height, weight, age, time, temperature, pressure, pH.
Probability: The probability of a continuous random variable taking any exact value is zero, i.e., . Instead, probabilities are calculated over intervals: , , .
Density Curves
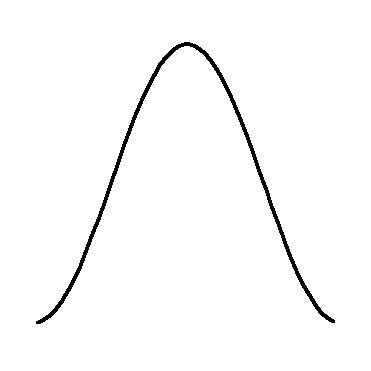
Density curves are graphical representations of the probability distribution of a continuous random variable. The area under the curve represents probability, and the total area is always 1.
Key Point: The density curve is used to model the distribution of continuous random variables.
Total Area: The total area under the density curve equals 1.
The Normal Distribution
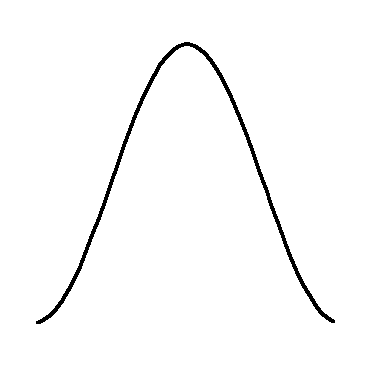
The normal probability distribution is a fundamental continuous distribution characterized by its mean () and standard deviation (). It is widely used in statistics due to its natural occurrence in many real-world phenomena.
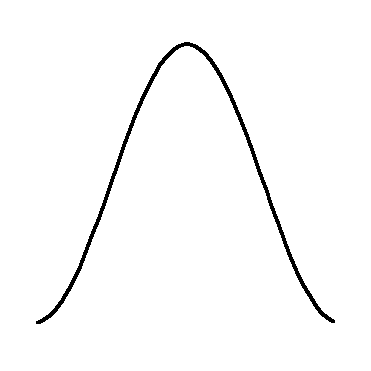
Definition: The normal distribution is a symmetric, bell-shaped distribution defined by its mean and standard deviation.
Characteristics:
The mean is at the center, and mean = mode = median.
The curve is symmetric and bell-shaped.
The standard deviation determines the width of the curve.
Total area under the curve is 1.
Formula: The probability density function (PDF) of the normal distribution is:
Standard Normal Distribution and Z-Scores
The standard normal distribution is a special case of the normal distribution with mean 0 and standard deviation 1. Z-scores are used to standardize values from any normal distribution.
Definition: The standard normal distribution has and .
Z-score: The Z-score transforms any normal variable to the standard normal:
Z-table: The Z-table provides probabilities for the standard normal distribution.
Empirical Rule (68-95-99.7 Rule)
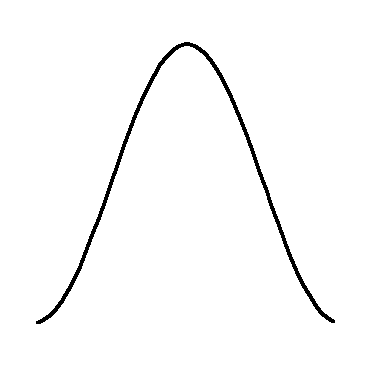
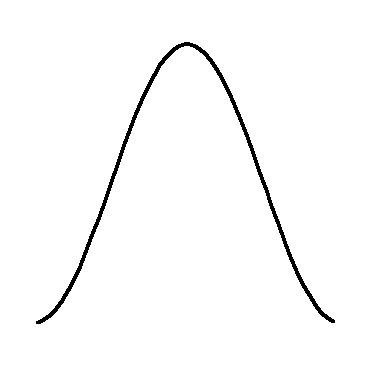
The empirical rule describes the proportion of values within certain standard deviations from the mean in a normal distribution.
68%: Within 1 standard deviation ()
95%: Within 1.96 standard deviations ()
99.7%: Within 3 standard deviations ()
Calculating Probabilities Using the Normal Distribution
Probabilities for intervals or specific values can be calculated using the normal distribution and Z-scores.
Transforming to Z: Use to convert any value to the standard normal.
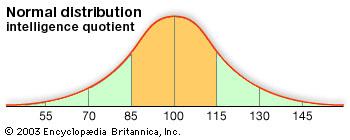
Example: For IQ scores with , , the percentage above 130 is found by calculating and using the Z-table.
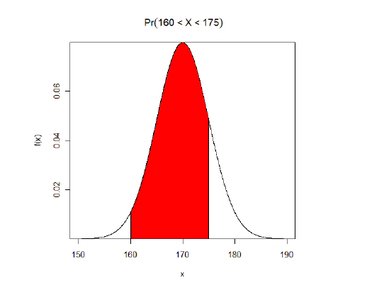
Interval Probability: is the area under the curve between and .
Applications of the Normal Distribution
The normal distribution is used in various statistical applications, including quality control, medical statistics, and employee appraisals.
Control Charts: Used to monitor processes; most values fall within 3 standard deviations of the mean.
Upper Control Limit (UCL):
Lower Control Limit (LCL):
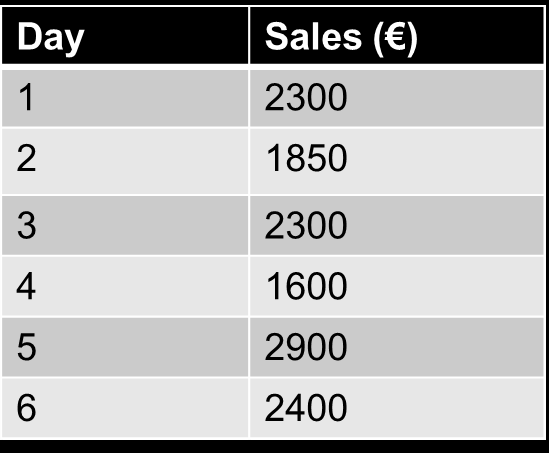
Example: Daily sales with , ; values outside UCL or LCL are unusual.
Day | Sales (€) |
|---|---|
1 | 2300 |
2 | 1850 |
3 | 2300 |
4 | 1600 |
5 | 2900 |
6 | 2400 |
Using Z-values to Identify Unusual Cases
Z-values allow comparison of individual cases to the population, identifying outliers or unusual values.
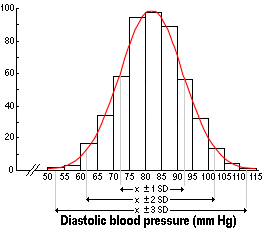
Example: Diastolic blood pressure in adult males ( mm Hg, mm Hg). A patient with 125 mm Hg has , which is highly unusual.
Employee Appraisals and Forced Ranking
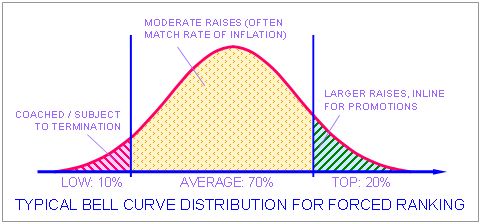
Normal distribution is sometimes used in employee appraisals for large groups, but is less useful for small teams.
Application: Forced ranking systems assume employee performance follows a normal distribution.
Summary
Normal distribution is defined by its mean and standard deviation.
Z-table gives probabilities for the standard normal distribution.
Any normal distribution value can be transformed to a z-value using .
