 뒤로
뒤로Normal Probability Distributions: Study Notes
스터디 가이드 - 스마트 노트
 자료에 맞춘 맞춤형 노트, 핵심 정의, 예시, 맥락을 확장해 제공합니다.
Normal Probability Distributions
Introduction to Continuous Random Variables
Continuous random variables (CRVs) can take any value within a given range and are not restricted to isolated points, unlike discrete random variables. Probabilities for CRVs are determined by calculating the area under a probability density function (PDF) over a specified interval.
Discrete Random Variable: Can only take specific, separate values (e.g., number of die rolls).
Continuous Random Variable: Can take any value within an interval (e.g., time, distance).
Probability for CRV: is the area under the PDF from to .
Example: For a die roll (discrete), . For a continuous variable, probability is found by integrating the PDF over the interval.
Uniform Distribution
The uniform distribution is a type of continuous probability distribution where every value within a certain interval is equally likely. The PDF is constant over the interval.
Probability Density Function: for
Total Area: The total area under the PDF is always 1.
Probability Calculation:
Example: If response time is uniformly distributed between 2 and 12 seconds, the probability that a call is answered in 5-9 seconds is .
Probability Density Functions (PDFs)
A valid PDF must satisfy two conditions: (1) for all , and (2) the total area under the curve is 1. Probabilities are found by calculating the area under the curve for the desired interval.
Check for Valid PDF: Integrate over its domain; result must be 1.
Probability:
Standard Normal Distribution
The standard normal distribution is a normal distribution with mean and standard deviation . Probabilities are found using the standard normal (z) table, which gives cumulative probabilities from the left up to a given z-score.
Z-Score:
Finding Probabilities: Use the z-table to find or .
Area to the Right:
Area Between Two Z-Scores:
Example: (from z-table), .
Finding Z-Scores from Probabilities
To find the z-score corresponding to a given probability (area), use the z-table in reverse. If the area is to the right, subtract from 1 to get the area to the left, then look up the z-score.
Given Area to Left: Find z such that .
Given Area to Right: Find z such that ; use .
Example: If , z-score is approximately 0.34 (from z-table).
Using the TI-84 Calculator for Normal Probabilities
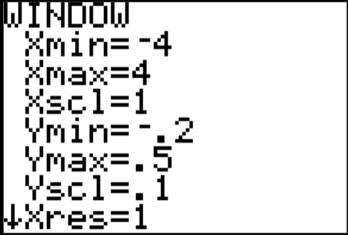
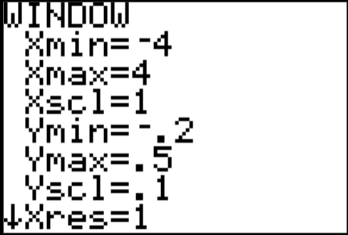
The TI-84 calculator can quickly compute probabilities and z-scores for normal distributions using built-in functions.
Finding Probability from Z-Score: Use normalcdf or ShadeNorm functions.
Finding Z-Score from Probability: Use invNorm function.
Standard Normal Parameters: ,
Non-Standard Normal Distributions
For normal distributions with mean or standard deviation , convert values to z-scores before using the standard normal table or calculator.
Z-Score Formula:
Finding Probabilities: Convert to , then use the z-table or calculator.
Example: Commute times are normal with , . Probability of less than 10 minutes: , .
Finding Values from Probabilities (Non-Standard Normal)
To find the value corresponding to a given probability, first find the z-score from the probability, then solve for $x$ using the mean and standard deviation.
Value from Probability:
Example: Heights of women are normal with cm, cm. Find such that 5% are shorter than $x$: , cm.
Summary Table: Key Formulas and Functions
Concept | Formula/Function | Description |
|---|---|---|
Uniform PDF | For | |
Probability (Uniform) | Area under PDF | |
Z-Score | Standardizes value | |
Probability (Standard Normal) | z-table, calculator | Find area under curve |
Value from Probability | Reverse standardization |
Additional info: These notes cover the essentials of continuous random variables, the uniform and normal distributions, and practical calculation methods using tables and calculators, as outlined in a typical college statistics course (Ch. 6 - Normal Probability Distributions).
