 뒤로
뒤로Statistical Inference for Employee Satisfaction Index (ESI)
스터디 가이드 - 스마트 노트
 자료에 맞춘 맞춤형 노트, 핵심 정의, 예시, 맥락을 확장해 제공합니다.
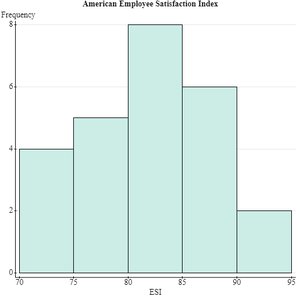
Q6. An international company is aware that the mean Employee Satisfaction Index (ESI) within its Denmark-based branches is excellent, being 90, on a scale from 0 to 100. A union representative wishes to ascertain if the same mean of 90 is achieved or not within the company’s U.S.-based branches. Here are some summary statistics and a histogram of the ESIs obtained from a random sample of 25 U.S. employees.
Background
Topic: Hypothesis Testing for Means (One-Sample t-Test)
This question tests your understanding of hypothesis testing for a population mean, including setting up hypotheses, checking assumptions, calculating test statistics and p-values, and interpreting confidence intervals. The histogram helps assess normality, which is important for the t-test.
Key Terms and Formulas
Null Hypothesis (): The mean ESI in U.S. branches is 90 ().
Alternative Hypothesis (): The mean ESI in U.S. branches is not 90 ().
Test Statistic:
Confidence Interval:
Assumptions: Random sample, approximately normal distribution (check histogram), independence.
Step-by-Step Guidance
Write the null and alternative hypotheses:
Check assumptions: Is the sample random? Is the sample size large enough or is the data approximately normal? Use the histogram to assess normality.
Calculate the test statistic using the formula: Where , , , .
Find the p-value associated with your calculated t-statistic using the t-distribution with degrees of freedom.
Construct a 95% confidence interval for the mean ESI using: Where is the critical value for 95% confidence and 24 degrees of freedom.
Try solving on your own before revealing the answer!
Final Answer:
1. Hypotheses: , 2. Assumptions: The histogram shows approximate normality, sample is random. 3. Test statistic: 4. p-value: (very small) 5. Conclusion: There is strong evidence that the mean ESI in U.S. branches is less than 90. 6. 95% Confidence Interval: 7. Interpretation: The interval does not include 90, so the union representative should advocate for better working conditions in the U.S. branches.
