 뒤로
뒤로Using the Standard Normal Distribution Table in Statistics
스터디 가이드 - 스마트 노트
 자료에 맞춘 맞춤형 노트, 핵심 정의, 예시, 맥락을 확장해 제공합니다.
Normal Probability Distributions
Standard Normal Distribution
The standard normal distribution is a special case of the normal distribution with a mean of 0 and a standard deviation of 1. It is used extensively in statistics to calculate probabilities and critical values for hypothesis testing and confidence intervals.
Mean (μ): 0
Standard Deviation (σ): 1
Notation: Z ~ N(0, 1)
The standard normal distribution is symmetric about the mean, and the total area under the curve is 1.
Z-Scores
A z-score is a standardized value that indicates how many standard deviations a data point is from the mean. Z-scores are used to compare values from different normal distributions and to find probabilities using the standard normal table.
Formula:
X: Raw score
μ: Population mean
σ: Population standard deviation
Positive z-scores are above the mean, and negative z-scores are below the mean.
Using the Standard Normal Table
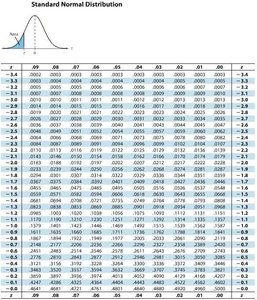
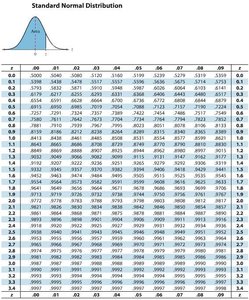
The standard normal table (z-table) provides the area (probability) to the left of a given z-score under the standard normal curve. This area represents the cumulative probability up to that z-score.
To find the probability that Z is less than a value (P(Z < z)), locate the z-score in the table and read the corresponding area.
To find the probability that Z is greater than a value (P(Z > z)), subtract the table value from 1.
To find the probability between two z-scores, subtract the smaller area from the larger area.
Example: Finding Probabilities Using the Z-Table
Example 1: Find P(Z < 1.25).
Locate 1.2 in the leftmost column and 0.05 in the top row. The intersection gives the area to the left of z = 1.25.
From the table, P(Z < 1.25) ≈ 0.8944.
Example 2: Find P(Z > -0.75).
Find the area to the left of z = -0.75 (from the table, ≈ 0.2266).
P(Z > -0.75) = 1 - 0.2266 = 0.7734.
Interpreting the Table
The table is typically split into two parts: one for negative z-scores and one for positive z-scores. Each cell gives the cumulative probability from the far left up to the specified z-score.
z | Area to the Left |
|---|---|
-1.0 | 0.1587 |
0.0 | 0.5000 |
1.0 | 0.8413 |
2.0 | 0.9772 |
3.0 | 0.9987 |
Additional info: The table values are cumulative probabilities, which are essential for calculating p-values and critical values in hypothesis testing and for constructing confidence intervals.
