

Ch. 10 - Chi-Square Tests and the F-Distribution
Larson - Elementary Statistics: Picturing the World 8th Edition
Larson8th EditionElementary Statistics: Picturing the WorldISBN: 9780137493470당신이 사용하는 게 아니라요?교과서 변경
10장, 문제 10.2.42

Conditional Relative Frequencies In Exercises 37–42, use the contingency table from Exercises 33–36, and the information below.
Relative frequencies can also be calculated based on the row totals (by dividing each row entry by the row’s total) or the column totals (by dividing each column entry by the column’s total). These frequencies are conditional relative frequencies and can be used to determine whether an association exists between two categories in a contingency table.


What percent of U.S. adults ages 25 and over who are not high school graduates are unemployed?

검증된 단계별 안내
1
Step 1: Identify the relevant data from the contingency table. Specifically, locate the row corresponding to 'U.S. adults ages 25 and over who are not high school graduates' and the column corresponding to 'unemployed.'
Step 2: Find the total number of U.S. adults ages 25 and over who are not high school graduates (row total). This will be used as the denominator in the calculation.
Step 3: Find the number of unemployed individuals within the group of U.S. adults ages 25 and over who are not high school graduates (specific cell value in the contingency table). This will be used as the numerator in the calculation.
Step 4: Calculate the conditional relative frequency by dividing the number of unemployed individuals (numerator) by the total number of individuals in the row (denominator). Use the formula: UnemployedRow Total.
Step 5: Convert the result into a percentage by multiplying the conditional relative frequency by 100. This percentage represents the proportion of U.S. adults ages 25 and over who are not high school graduates and are unemployed.

비슷한 문제에 대한 검증된 영상 답변:

이 영상 해법은 위 문제에 도움이 된다고 튜터들이 추천한 것입니다.
영상 길이:
3m
도움이 되었나요?

주요 개념

질문에 올바르게 답하기 위해 반드시 이해해야 하는 핵심 개념들은 다음과 같습니다.

Contingency Table

A contingency table is a type of data representation that displays the frequency distribution of variables. It allows for the examination of the relationship between two categorical variables by showing how the categories intersect. Each cell in the table represents the count of occurrences for a specific combination of categories, making it easier to analyze patterns and associations.
추천 영상:
가이드 코스
08:18
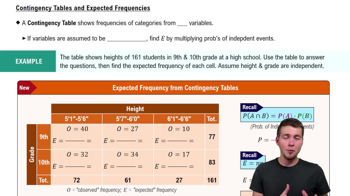
Contingency Tables & Expected Frequencies

Relative Frequency

Relative frequency is a measure that shows the proportion of a specific category relative to the total number of observations. It is calculated by dividing the frequency of a category by the total number of observations, often expressed as a percentage. This concept is crucial for understanding the distribution of data and making comparisons between different categories within a dataset.
추천 영상:
가이드 코스
06:38
Intro to Frequency Distributions

Conditional Relative Frequency

Conditional relative frequency refers to the relative frequency of a category given a specific condition or subset of data. It is calculated by dividing the frequency of a category by the total frequency of the condition being considered. This concept helps in assessing the relationship between two variables by focusing on the frequencies within a particular group, allowing for insights into associations and dependencies.
추천 영상:
가이드 코스
06:38
Intro to Frequency Distributions
관련 실천
교과서 질문

Testing for Normality Using a chi-square goodness-of-fit test, you can decide, with some degree of certainty, whether a variable is normally distributed. In all chi-square tests for normality, the null and alternative hypotheses are as listed below.


H₀: The variable has a normal distribution.


Hₐ: The variable does not have a normal distribution.


To determine the expected frequencies when performing a chi-square test for normality, first estimate the mean and standard deviation of the frequency distribution. Then, use the mean and standard deviation to compute the z-score for each class boundary. Then, use the z-scores to calculate the area under the standard normal curve for each class. Multiplying the resulting class areas by the sample size yields the expected frequency for each class.In Exercises 17 and 18, (a) find the expected frequencies, (b) find the critical value and identify the rejection region, (c) find the chi-square test statistic, (d) decide whether to reject or fail to reject the null hypothesis, and (e) interpret the decision in the context of the original claim.


In Exercises 17 and 18, (a) find the expected frequencies, (b) find the critical value and identify the rejection region, (c) find the chi-square test statistic, (d) decide whether to reject or fail to reject the null hypothesis, and (e) interpret the decision in the context of the original claim.


Test Scores At α=0.01, test the claim that the 200 test scores shown in the frequency distribution are normally distributed.


280
views
교과서 질문

"Finding a Critical F-Value for a Right-Tailed Test In Exercises 5–8, find the critical F-value for a right-tailed test using the level of significance α and degrees of freedom d.f.N and d.f.D.


α=0.05, d.f.N=9, d.f.D=16"

77
views
교과서 질문

Describe the hypotheses for a two-way ANOVA test.

231
views
교과서 질문

"Finding a Critical F-Value for a Two-Tailed Test In Exercises 9–12, find the critical F-value for a two-tailed test using the level of significance α and degrees of freedom d.f.N and d.f.D.


α=0.05, d.f.N=27, d.f.D=19"

92
views
교과서 질문

Contingency Tables and Relative Frequencies In Exercises 33–36, use the information below.

The frequencies in a contingency table can be written as relative frequencies by dividing each frequency by the sample size. The contingency table below shows the number of U.S. adults (in millions) ages 25 and over by employment status and educational attainment. (Adapted from U.S. Census Bureau)


What percent of U.S. adults ages 25 and over (a) are employed and are only high school graduates, (b) are not in the civilian labor force, and (c) are not high school graduates?

96
views
교과서 질문

"Finding a Critical F-Value for a Right-Tailed Test In Exercises 5–8, find the critical F-value for a right-tailed test using the level of significance α and degrees of freedom d.f.N and d.f.D.


α=0.01, d.f.N=2, d.f.D=11"

49
views