


Ch. 10 - Chi-Square Tests and the F-Distribution
Larson - Elementary Statistics: Picturing the World 8th Edition
Larson8th EditionElementary Statistics: Picturing the WorldISBN: 9780137493470당신이 사용하는 게 아니라요?교과서 변경
10장, 문제 10.2.36

Contingency Tables and Relative Frequencies In Exercises 33–36, use the information below.
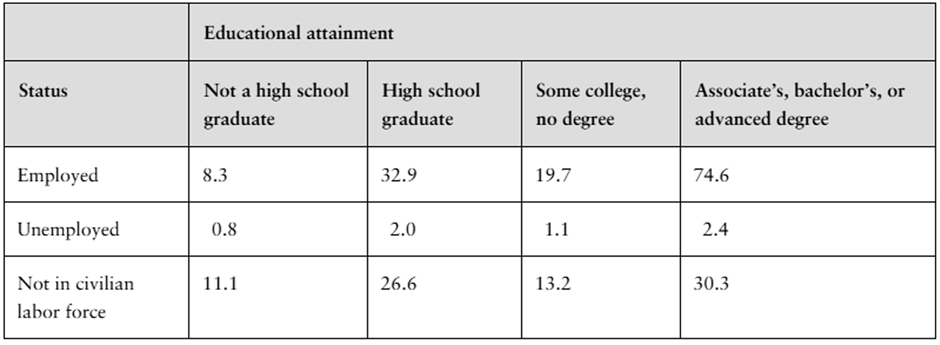
The frequencies in a contingency table can be written as relative frequencies by dividing each frequency by the sample size. The contingency table below shows the number of U.S. adults (in millions) ages 25 and over by employment status and educational attainment. (Adapted from U.S. Census Bureau)
Contingency table showing U.S. adults' employment status by educational attainment in millions.


What percent of U.S. adults ages 25 and over (a) are employed and are only high school graduates, (b) are not in the civilian labor force, and (c) are not high school graduates?

검증된 단계별 안내
1
Step 1: Calculate the total sample size by summing all the frequencies in the contingency table. Add all the values across rows and columns to find the total number of U.S. adults ages 25 and over.
Step 2: To find the percentage of U.S. adults who are employed and are only high school graduates, divide the frequency for 'Employed' and 'High school graduate' (32.9) by the total sample size calculated in Step 1. Multiply the result by 100 to convert it to a percentage.
Step 3: To find the percentage of U.S. adults who are not in the civilian labor force, divide the total frequency for 'Not in civilian labor force' (sum of 11.1, 26.6, 13.2, and 30.3) by the total sample size calculated in Step 1. Multiply the result by 100 to convert it to a percentage.
Step 4: To find the percentage of U.S. adults who are not high school graduates, divide the total frequency for 'Not a high school graduate' (sum of 8.3, 0.8, and 11.1) by the total sample size calculated in Step 1. Multiply the result by 100 to convert it to a percentage.
Step 5: Interpret the percentages calculated in Steps 2, 3, and 4 to answer parts (a), (b), and (c) of the question. Ensure the percentages are rounded appropriately if needed.

비슷한 문제에 대한 검증된 영상 답변:

이 영상 해법은 위 문제에 도움이 된다고 튜터들이 추천한 것입니다.
영상 길이:
7m
도움이 되었나요?

주요 개념

질문에 올바르게 답하기 위해 반드시 이해해야 하는 핵심 개념들은 다음과 같습니다.

Contingency Tables

A contingency table is a type of data representation that displays the frequency distribution of variables. It allows for the examination of the relationship between two categorical variables, such as employment status and educational attainment in this case. Each cell in the table represents the count of observations that fall into the corresponding categories, facilitating analysis of patterns and associations.
추천 영상:
가이드 코스
08:18
Contingency Tables & Expected Frequencies

Relative Frequencies

Relative frequencies are calculated by dividing the frequency of a specific category by the total number of observations in the dataset. This provides a proportion or percentage that indicates how common a particular category is relative to the whole. In the context of the question, converting frequencies to relative frequencies helps in understanding the distribution of employment status among different educational attainment levels.
추천 영상:
가이드 코스
06:38
Intro to Frequency Distributions

Percentages in Statistics

Percentages are a way to express a number as a fraction of 100, making it easier to compare different groups or categories. In statistics, calculating percentages from relative frequencies allows for a clearer interpretation of data, such as determining what percent of U.S. adults are employed based on their educational background. This is particularly useful in analyzing demographic data and making informed conclusions.
추천 영상:
가이드 코스
05:53
Parameters vs. Statistics
관련 실천
교과서 질문

Conditional Relative Frequencies In Exercises 37–42, use the contingency table from Exercises 33–36, and the information below.

Relative frequencies can also be calculated based on the row totals (by dividing each row entry by the row’s total) or the column totals (by dividing each column entry by the column’s total). These frequencies are conditional relative frequencies and can be used to determine whether an association exists between two categories in a contingency table.


What percent of U.S. adults ages 25 and over who are not high school graduates are unemployed?

80
views
교과서 질문

Describe the hypotheses for a two-way ANOVA test.

231
views
교과서 질문

"Finding a Critical F-Value for a Two-Tailed Test In Exercises 9–12, find the critical F-value for a two-tailed test using the level of significance α and degrees of freedom d.f.N and d.f.D.


α=0.05, d.f.N=27, d.f.D=19"

92
views
교과서 질문

Performing a Chi-Square Goodness-of-Fit Test

In Exercises 7–16, (a) identify the claim and state H₀ and Hₐ, (b) find the critical value and identify the rejection region, (c) find the chi-square test statistic, (d) decide whether to reject or fail to reject the null hypothesis, and (e) interpret the decision in the context of the original claim.


Births by Day of the Week A doctor claims that the number of births by day of the week is uniformly distributed. To test this claim, you randomly select 700 births from a recent year and record the day of the week on which each takes place. The table shows the results. At α=0.10, test the doctor’s claim. (Adapted from National Center for Health Statistics)


148
views
교과서 질문

"Finding a Critical F-Value for a Two-Tailed Test In Exercises 9–12, find the critical F-value for a two-tailed test using the level of significance α and degrees of freedom d.f.N and d.f.D.


α=0.05, d.f.N=60, d.f.D=40"

101
views
교과서 질문

"Finding a Critical F-Value for a Right-Tailed Test In Exercises 5–8, find the critical F-value for a right-tailed test using the level of significance α and degrees of freedom d.f.N and d.f.D.


α=0.01, d.f.N=2, d.f.D=11"

49
views