

Ch. 2 - Descriptive Statistics
Larson - Elementary Statistics: Picturing the World 8th Edition
Larson8th EditionElementary Statistics: Picturing the WorldISBN: 9780137493470당신이 사용하는 게 아니라요?교과서 변경
2장, 문제 2.R.17

In Exercises 17–19, use the data set, which represents the points recorded by each player on the Winnipeg Jets in the 2019–2020 NHL season. (Source: National Hockey League)
8 8 8 6 0 73 26 1
0 5 58 1 7 5 10 63
0 5 10 0 31 5 15 45
16 29 10 73 5 3 0 65


Construct a frequency distribution for the data set using eight classes. Include class limits, midpoints, boundaries, frequencies, relative frequencies, and cumulative frequencies.

검증된 단계별 안내
1
Step 1: Determine the range of the data set by subtracting the smallest value from the largest value. This will help in constructing the classes.
Step 2: Divide the range by the number of classes (8 in this case) to calculate the class width. Round up to the nearest whole number if necessary.
Step 3: Define the class limits for each of the eight classes. Start with the smallest value as the lower limit of the first class, and add the class width to determine the upper limit of each class.
Step 4: Calculate the midpoints for each class using the formula: midpoint = (lower limit + upper limit) / 2.
Step 5: Count the number of data points that fall within each class to determine the frequencies. Then calculate the relative frequencies (frequency / total number of data points) and cumulative frequencies (sum of frequencies up to that class).

비슷한 문제에 대한 검증된 영상 답변:

이 영상 해법은 위 문제에 도움이 된다고 튜터들이 추천한 것입니다.
영상 길이:
4m
도움이 되었나요?

주요 개념

질문에 올바르게 답하기 위해 반드시 이해해야 하는 핵심 개념들은 다음과 같습니다.

Frequency Distribution

A frequency distribution is a summary of how often each value occurs in a dataset. It organizes data into classes or intervals, showing the number of observations (frequency) that fall within each class. This helps in visualizing the distribution of data points and identifying patterns or trends.
추천 영상:
가이드 코스
06:38
Intro to Frequency Distributions

Class Limits and Midpoints

Class limits define the range of values that fall into each class in a frequency distribution. The midpoint of a class is calculated as the average of the upper and lower class limits, providing a representative value for that class. These concepts are essential for summarizing data and facilitating further statistical analysis.
추천 영상:
가이드 코스
04:15
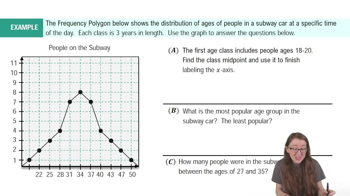
Frequency Polygons Example 1

Relative and Cumulative Frequencies

Relative frequency is the proportion of the total number of observations that fall within a specific class, calculated by dividing the class frequency by the total number of observations. Cumulative frequency, on the other hand, is the running total of frequencies up to a certain class, allowing for the analysis of data distribution across multiple classes. Both are important for understanding the overall distribution of data.
추천 영상:
가이드 코스
06:38
Intro to Frequency Distributions
관련 실천
교과서 질문

In Exercises 37– 40, use the data set, which represents the model 2020 vehicles with the highest fuel economies (in miles per gallon) in the most popular classes. (Source: U.S. Environmental Protection Agency)

36 30 30 45 31 113 113 33 33 33 52 141 56 117 58

118 50 26 23 23 27 48 22 22 22 121 41 105 35 35


Find the five-number summary of the data set.

89
views
교과서 질문

The towing capacities (in pounds) of all the pickup trucks at a dealership have a bell-shaped distribution, with a mean of 11,830 pounds and a standard deviation of 2370 pounds. In Exercises 45– 48, use the corresponding z-score to determine whether the towing capacity is unusual. Explain your reasoning.


5,500 pounds

68
views
교과서 질문

In Exercises 37– 40, use the data set, which represents the model 2020 vehicles with the highest fuel economies (in miles per gallon) in the most popular classes. (Source: U.S. Environmental Protection Agency)

36 30 30 45 31 113 113 33 33 33 52 141 56 117 58

118 50 26 23 23 27 48 22 22 22 121 41 105 35 35


About how many vehicles fall on or below the third quartile?

134
views
교과서 질문

In Exercises 7 and 8, use the data set shown in the table at the left, which represents the pollution indices (a unitless measure of pollution ranging from 0 to 100) for 24 U.S. cities. (Adapted from Numbeo)

Use a dot plot to display the data set. Describe any patterns.

101
views
교과서 질문

In Exercises 21 and 22, determine whether the approximate shape of the distribution in the histogram is symmetric, uniform, skewed left, skewed right, or none of these.

122
views
교과서 질문

In Exercises 25 and 26, find the range, mean, variance, and standard deviation of the population data set.


The mileages (in thousands of miles) for a rental car company’s fleet.

4 2 9 12 15 3 6 8 1 4 14 12 3 3

96
views