Ch. 2 - Descriptive Statistics
Larson - Elementary Statistics: Picturing the World 8th Edition
Larson8th EditionElementary Statistics: Picturing the WorldISBN: 9780137493470당신이 사용하는 게 아니라요?교과서 변경
2장, 문제 2.R.22

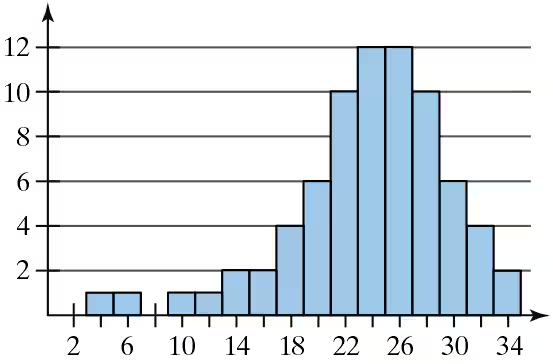
In Exercises 21 and 22, determine whether the approximate shape of the distribution in the histogram is symmetric, uniform, skewed left, skewed right, or none of these.
Histogram displaying frequency distribution with peaks around 22 and 26, illustrating data variability.

검증된 단계별 안내
1
Observe the histogram provided. Note the frequency of data points across the intervals on the x-axis and the height of the bars representing these frequencies.
Identify the general shape of the distribution. Look for patterns such as symmetry, peaks, or whether the data is concentrated more on one side.
Determine if the histogram is symmetric by checking if the left and right sides of the distribution are approximately mirror images of each other.
Check for skewness: If the tail of the distribution extends more to the left, it is skewed left. If the tail extends more to the right, it is skewed right.
If the histogram does not exhibit symmetry, skewness, or a uniform distribution, classify it as 'none of these.'

비슷한 문제에 대한 검증된 영상 답변:

이 영상 해법은 위 문제에 도움이 된다고 튜터들이 추천한 것입니다.
영상 길이:
5m
도움이 되었나요?

주요 개념

질문에 올바르게 답하기 위해 반드시 이해해야 하는 핵심 개념들은 다음과 같습니다.

Histogram

A histogram is a graphical representation of the distribution of numerical data, where the data is divided into intervals (bins) and the frequency of data points within each interval is represented by the height of the bars. It helps visualize the shape of the data distribution, making it easier to identify patterns such as central tendency, variability, and skewness.
추천 영상:
05:54
Intro to Histograms

Distribution Shape

The shape of a distribution refers to the way data points are spread across the range of values. Common shapes include symmetric (equal on both sides), uniform (equal frequency across intervals), skewed left (tail on the left), and skewed right (tail on the right). Understanding the shape is crucial for interpreting data characteristics and making statistical inferences.
추천 영상:
05:11
Sampling Distribution of Sample Proportion

Skewness

Skewness measures the asymmetry of a distribution. A distribution is skewed left if it has a longer tail on the left side, indicating that most data points are concentrated on the right. Conversely, a skewed right distribution has a longer tail on the right side. Identifying skewness helps in understanding the underlying data trends and can influence the choice of statistical methods for analysis.
추천 영상:
가이드 코스
04:41
Creating Frequency Polygons
관련 실천
교과서 질문

A student’s test grade of 75 represents the 65th percentile of the grades. What percent of students scored higher than 75?

289
views

교과서 질문

In Exercises 17–19, use the data set, which represents the points recorded by each player on the Winnipeg Jets in the 2019–2020 NHL season. (Source: National Hockey League)

8 8 8 6 0 73 26 1

0 5 58 1 7 5 10 63

0 5 10 0 31 5 15 45

16 29 10 73 5 3 0 65


Construct a frequency distribution for the data set using eight classes. Include class limits, midpoints, boundaries, frequencies, relative frequencies, and cumulative frequencies.

116
views
교과서 질문

The towing capacities (in pounds) of all the pickup trucks at a dealership have a bell-shaped distribution, with a mean of 11,830 pounds and a standard deviation of 2370 pounds. In Exercises 45– 48, use the corresponding z-score to determine whether the towing capacity is unusual. Explain your reasoning.


5,500 pounds

68
views
교과서 질문

In Exercises 7 and 8, use the data set shown in the table at the left, which represents the pollution indices (a unitless measure of pollution ranging from 0 to 100) for 24 U.S. cities. (Adapted from Numbeo)

Use a dot plot to display the data set. Describe any patterns.

101
views
교과서 질문

In Exercises 27 and 28, find the range, mean, variance, and standard deviation of the sample data set.


Salaries (in dollars) of a random sample of teachers

62,222 56,719 50,259 45,120 47,692 45,985 53,489 71,534

132
views
교과서 질문

Describe the shape of the distribution for the histogram you made in Exercise 3 as symmetric, uniform, skewed left, skewed right, or none of these.

162
views