Ch. 2 - Descriptive Statistics
Larson - Elementary Statistics: Picturing the World 8th Edition
Larson8th EditionElementary Statistics: Picturing the WorldISBN: 9780137493470당신이 사용하는 게 아니라요?교과서 변경
2장, 문제 2.Q.1g

The data set represents the number of minutes a sample of 27 people exercise each week.
108 139 120 123 120 132 123 131 131
157 150 124 111 101 135 119 116 117
127 128 139 119 118 114 127 142 130


g. Display the data using a box-and-whisker plot.

검증된 단계별 안내
1
Step 1: Organize the data in ascending order. This will help in identifying the minimum, maximum, quartiles, and median values. The ordered data set is: 101, 108, 111, 114, 116, 117, 118, 119, 119, 120, 120, 123, 123, 124, 127, 127, 128, 130, 131, 131, 132, 135, 139, 139, 142, 150, 157.
Step 2: Identify the five-number summary for the data set. These include the minimum value, first quartile (Q1), median (Q2), third quartile (Q3), and maximum value. Use the following definitions: Q1 is the median of the lower half of the data (excluding the overall median), Q2 is the median of the entire data set, and Q3 is the median of the upper half of the data (excluding the overall median).
Step 3: Calculate the interquartile range (IQR) to identify potential outliers. The formula for IQR is: IQR = Q3 - Q1. Any data point below Q1 - 1.5 \(\times\) IQR or above Q3 + 1.5 \(\times\) IQR is considered an outlier.
Step 4: Draw a number line that includes the range of the data. Plot the five-number summary (minimum, Q1, median, Q3, and maximum) on the number line. Use vertical lines to represent Q1, Q2, and Q3, and connect them with a box. Extend whiskers from the box to the minimum and maximum values that are not outliers.
Step 5: If there are any outliers, mark them as individual points outside the whiskers. Label the box-and-whisker plot appropriately to ensure clarity and interpretability.

비슷한 문제에 대한 검증된 영상 답변:

이 영상 해법은 위 문제에 도움이 된다고 튜터들이 추천한 것입니다.
영상 길이:
6m
도움이 되었나요?

주요 개념

질문에 올바르게 답하기 위해 반드시 이해해야 하는 핵심 개념들은 다음과 같습니다.

Box-and-Whisker Plot

A box-and-whisker plot, or box plot, is a graphical representation of a data set that displays its minimum, first quartile, median, third quartile, and maximum. The 'box' shows the interquartile range (IQR), which contains the middle 50% of the data, while the 'whiskers' extend to the smallest and largest values within 1.5 times the IQR from the quartiles. This plot is useful for visualizing the distribution, central tendency, and variability of the data.
추천 영상:
07:38
Residuals and Residual Plots

Quartiles

Quartiles are values that divide a data set into four equal parts, each containing 25% of the data. The first quartile (Q1) is the median of the lower half of the data, the second quartile (Q2) is the overall median, and the third quartile (Q3) is the median of the upper half. Understanding quartiles is essential for constructing a box-and-whisker plot, as they help identify the spread and center of the data.
추천 영상:
04:51
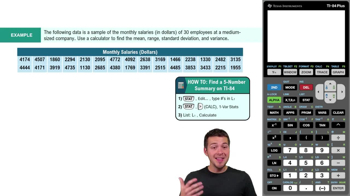
Find 5-Number Summary - TI-84 Calculator

Interquartile Range (IQR)

The interquartile range (IQR) is a measure of statistical dispersion that represents the range between the first quartile (Q1) and the third quartile (Q3). It is calculated as IQR = Q3 - Q1 and indicates the spread of the middle 50% of the data. The IQR is particularly useful for identifying outliers and understanding the variability within a data set, making it a key component in the construction of box-and-whisker plots.
추천 영상:
05:45
Find 5-Number Summary - TI-84 Calculator Example 1
관련 실천
교과서 질문

From a random sample of airplanes, the number of defects found in their fuselages are listed. Find the sample mean and the sample standard deviation of the data.

81
views

교과서 질문

Refer to the sample statistics from Exercise 5 and determine whether any of the house prices below are unusual. Explain your reasoning.


a. \$225,000

113
views
교과서 질문

The data set represents the number of minutes a sample of 27 people exercise each week.

108 139 120 123 120 132 123 131 131

157 150 124 111 101 135 119 116 117

127 128 139 119 118 114 127 142 130


a. Construct a frequency distribution for the data set using five classes. Include class limits, midpoints, boundaries, frequencies, relative frequencies, and cumulative frequencies.

150
views
교과서 질문

The heights (in feet) and the number of stories of the ten tallest buildings in New York City are listed. Use a scatter plot to display the data. Describe any patterns. (Source: Emporis)

157
views
교과서 질문

The data set represents the number of minutes a sample of 27 people exercise each week.

108 139 120 123 120 132 123 131 131

157 150 124 111 101 135 119 116 117

127 128 139 119 118 114 127 142 130

b. Display the data using a frequency histogram and a frequency polygon on the same axes.

33
views
교과서 질문

The mean sale per customer for 40 customers at a gas station is \$32.00, with a standard deviation of \$4.00. Using Chebychev’s Theorem, determine at least how many of the customers spent between \$24.00 and \$40.00.

88
views