Ch. 2 - Descriptive Statistics
Larson - Elementary Statistics: Picturing the World 8th Edition
Larson8th EditionElementary Statistics: Picturing the WorldISBN: 9780137493470당신이 사용하는 게 아니라요?교과서 변경
2장, 문제 2.R.34

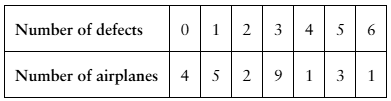
From a random sample of airplanes, the number of defects found in their fuselages are listed. Find the sample mean and the sample standard deviation of the data.
tab1

검증된 단계별 안내
1
Step 1: Organize the data into a frequency distribution table. The 'Number of defects' column represents the values (x), and the 'Number of airplanes' column represents the frequencies (f).
Step 2: Calculate the sample mean using the formula: μ=fxf. Multiply each defect value (x) by its frequency (f), sum these products, and divide by the total frequency.
Step 3: Calculate the sample variance using the formula: s²=f(x-μ)2f-1. Subtract the mean from each defect value (x), square the result, multiply by the frequency (f), sum these values, and divide by the total frequency minus 1.
Step 4: Calculate the sample standard deviation by taking the square root of the sample variance: s=s².
Step 5: Interpret the results. The sample mean represents the average number of defects per airplane, and the sample standard deviation measures the variability of defects among the airplanes.

비슷한 문제에 대한 검증된 영상 답변:

이 영상 해법은 위 문제에 도움이 된다고 튜터들이 추천한 것입니다.
영상 길이:
3m
도움이 되었나요?

주요 개념

질문에 올바르게 답하기 위해 반드시 이해해야 하는 핵심 개념들은 다음과 같습니다.

Sample Mean

The sample mean is the average of a set of values, calculated by summing all the values and dividing by the number of observations. In this context, it represents the average number of defects per airplane in the sample. It provides a central value that summarizes the data, allowing for easier interpretation of the defect distribution.
추천 영상:
가이드 코스
05:11
Sampling Distribution of Sample Proportion

Sample Standard Deviation

The sample standard deviation measures the amount of variation or dispersion in a set of values. It quantifies how much the individual data points differ from the sample mean. A low standard deviation indicates that the data points are close to the mean, while a high standard deviation suggests a wider spread of values, which is crucial for understanding the reliability of the defect counts.
추천 영상:
가이드 코스
08:45
Calculating Standard Deviation

Frequency Distribution

A frequency distribution is a summary of how often each value occurs in a dataset. In this case, the table shows the number of defects and the corresponding number of airplanes, allowing for the calculation of the mean and standard deviation. Understanding this distribution is essential for analyzing the data and interpreting the results accurately.
추천 영상:
가이드 코스
06:38
Intro to Frequency Distributions