


Ch. 2 - Descriptive Statistics
Larson - Elementary Statistics: Picturing the World 8th Edition
Larson8th EditionElementary Statistics: Picturing the WorldISBN: 9780137493470당신이 사용하는 게 아니라요?교과서 변경
2장, 문제 2.1.19a

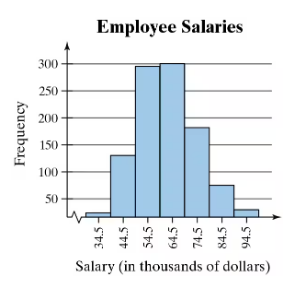
Use the frequency histogram
a. to determine the number of classes.
Histogram displaying employee salaries in thousands of dollars, with frequency counts on the vertical axis.

검증된 단계별 안내
1
Step 1: Observe the histogram provided. A histogram is a graphical representation of the distribution of data using bars, where each bar represents a class interval and its height corresponds to the frequency of data within that interval.
Step 2: Identify the class intervals on the x-axis. In this histogram, the intervals are labeled as 34.5-44.5, 44.5-54.5, 54.5-64.5, 64.5-74.5, 74.5-84.5, and 84.5-94.5.
Step 3: Count the number of distinct class intervals. Each interval represents a class, and the total number of intervals gives the number of classes.
Step 4: Verify that the intervals are non-overlapping and cover the entire range of the data. This ensures that the histogram is properly constructed and the number of classes is accurate.
Step 5: Conclude the number of classes based on the count from Step 3. In this case, there are six distinct class intervals visible in the histogram.

비슷한 문제에 대한 검증된 영상 답변:

이 영상 해법은 위 문제에 도움이 된다고 튜터들이 추천한 것입니다.
영상 길이:
1m
도움이 되었나요?

주요 개념

질문에 올바르게 답하기 위해 반드시 이해해야 하는 핵심 개념들은 다음과 같습니다.

Frequency Histogram

A frequency histogram is a graphical representation of the distribution of numerical data. It displays the frequency of data points within specified intervals, known as bins or classes. Each bar's height corresponds to the number of observations in that interval, allowing for a visual interpretation of the data's distribution and central tendencies.
추천 영상:
05:54
Intro to Histograms

Classes (Bins)

In the context of a histogram, classes (or bins) are the intervals into which the data is divided. The choice of the number of classes can affect the histogram's appearance and the insights drawn from it. A well-chosen number of classes helps to reveal patterns in the data, such as peaks and gaps, while too few or too many can obscure important information.
추천 영상:
05:54
Intro to Histograms

Determining the Number of Classes

Determining the number of classes for a histogram is crucial for effective data visualization. Common methods include Sturges' rule, which suggests using the formula k = 1 + 3.322 log(n), where k is the number of classes and n is the number of data points. This approach helps balance detail and clarity, ensuring that the histogram accurately represents the data's distribution.
추천 영상:
06:14
Coefficient of Determination
관련 실천
교과서 질문

The data set represents the number of movies that a sample of 20 people watched in a year.

121 148 94 142 170 88 221 106 18 67

149 28 60 101 134 168 92 154 53 66

b. Display the data using a frequency histogram and a frequency polygon on the same axes.

23
views
교과서 질문

Use the frequency distribution in Exercise 4 to estimate the sample mean and sample standard deviation of the data. Do the formulas for grouped data give results that are as accurate as the individual entry formulas? Explain.

139
views
교과서 질문

The mean gestational length of a sample of 208 horses is 343.7 days, with a standard deviation of 10.4 days. The data set has a bell-shaped distribution.


b. Determine whether a gestational length of 318.4 days is unusual.

75
views
교과서 질문

Extending Concepts


Golf The distances (in yards) for nine holes of a golf course are listed.

336 393 408 522 147 504 177 375 360


a. Find the mean and the median of the data.

87
views
교과서 질문

Drawing a Box-and-Whisker Plot In Exercises 15–18,

(a) find the five-number summary


2 7 1 3 1 2 8 9 9 2 5 4 7 3 7 5 4

2 3 5 9 5 6 3 9 3 4 9 8 8 2 3 9 5

172
views
교과서 질문

What Would You Do? You work at a bank and are asked to recommend the amount of cash to put in an ATM each day. You do not want to put in too much (which would cause security concerns) or too little (which may create customer irritation). The daily withdrawals (in hundreds of dollars) for 30 days are listed. 72 84 61 76 104 76 86 92 80 88 98 76 97 82 84 67 70 81 82 89 74 73 86 81 85 78 82 80 91 83

Construct a relative frequency histogram for the data. Use 8 classes.

112
views