

Ch. 3 - Probability
Larson - Elementary Statistics: Picturing the World 8th Edition
Larson8th EditionElementary Statistics: Picturing the WorldISBN: 9780137493470당신이 사용하는 게 아니라요?교과서 변경
3장, 문제 3.3.19c

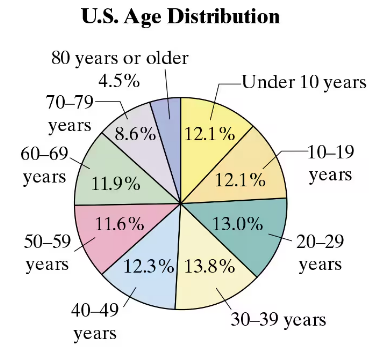
19. U.S. Age Distribution The projected percent distribution of the U.S. population for 2025 is shown in the pie chart. Find the probability of each event. (Source: U.S. Census
Bureau)
c. Randomly selecting someone who is not 60 years or over
Pie chart showing U.S. age distribution for 2025, with percentages for various age groups from under 10 to 80 years or older.

검증된 단계별 안내
1
Step 1: Identify the age groups that are 60 years or over. From the pie chart, these groups are: 60–69 years (11.9%), 70–79 years (8.6%), and 80 years or older (4.5%).
Step 2: Add the percentages of these age groups to find the total percentage of the population that is 60 years or over. Use the formula: Total percentage = 11.9% + 8.6% + 4.5%.
Step 3: Subtract the total percentage of the population that is 60 years or over from 100% to find the percentage of the population that is not 60 years or over. Use the formula: Percentage not 60 years or over = 100% - Total percentage of 60 years or over.
Step 4: Convert the percentage of the population that is not 60 years or over into a probability. Since probability is expressed as a decimal, divide the percentage by 100. Use the formula: Probability = Percentage / 100.
Step 5: Interpret the result. The probability represents the likelihood of randomly selecting someone who is not 60 years or over from the U.S. population in 2025.

비슷한 문제에 대한 검증된 영상 답변:

이 영상 해법은 위 문제에 도움이 된다고 튜터들이 추천한 것입니다.
영상 길이:
2m
도움이 되었나요?

주요 개념

질문에 올바르게 답하기 위해 반드시 이해해야 하는 핵심 개념들은 다음과 같습니다.

Probability

Probability is a measure of the likelihood that a particular event will occur, expressed as a number between 0 and 1. In this context, it involves calculating the chance of randomly selecting an individual from a specific age group based on the distribution percentages shown in the pie chart.
추천 영상:
가이드 코스
5:37
Introduction to Probability

Complementary Events

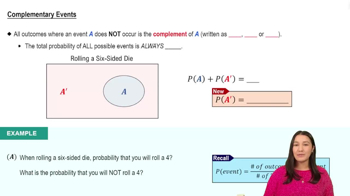
Complementary events are pairs of outcomes in probability that cover all possible outcomes of an experiment. For instance, in this question, selecting someone who is not 60 years or older is the complement of selecting someone who is 60 years or older, allowing for easier probability calculations.
추천 영상:
가이드 코스
4:23
Complementary Events

Pie Chart Interpretation

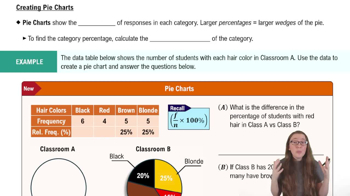
A pie chart visually represents data in a circular format, where each slice corresponds to a category's proportion of the whole. Understanding how to read the pie chart is crucial for determining the age distribution percentages, which are necessary for calculating the required probabilities.
추천 영상:
가이드 코스
06:10
Creating Pie Charts
관련 실천
교과서 질문

"Using the Multiplication Rule In Exercises 19-32, use the Multiplication Rule.

27. Blood Types The probability that a person of Asian descent in the United States has type O+ blood is 39%. At random, six people of Asian descent in the United States are selected. (Source: American National Red Cross)

b. Find the probability that none of the six have type O+ blood."

54
views
교과서 질문

"Using the Multiplication Rule In Exercises 19-32, use the Multiplication Rule.

25. Best President In a sample of 1500 adult U.S. citizens, 270 said that Barack Obama was the best president in U.S. history. Two adult U.S. citizens are selected at random.

(Adapted from YouGov)

c. Find the probability that at least one of the two adult U.S. citizens says that Barack Obama was the best president in U.S. history."

42
views
교과서 질문

"Using the Multiplication Rule In Exercises 19-32, use the Multiplication Rule.

23. Celebrities as Role Models In a sample of 1103 probable voters, three out of four say they would like entertainers to address social and political issues. Two probable voters are selected at random. (Source: The Hollywood Reporter)

c. Find the probability that at least one of the two probable voters would like entertainers to address social and political issues."

59
views
교과서 질문

88. Individual Stock Price An individual stock is selected at random from the portfolio represented by the box-and-whisker plot shown. Find the probability that the stock price is between \$21 and \$50.

82
views
교과서 질문

17. Selecting a Card A card is selected at random from a standard deck of 52 playing cards. Find the probability of each event.

c. Randomly selecting a 9 or a face card

388
views
교과서 질문

23. Engineering Degrees The table shows the numbers of male and female students in the U.S. who received B.S. degrees in engineering in a recent year. A student earning a B.S. degree in engineering during that year is selected at random. Find the probability of each event.

(Source: National Center for Educational Statistics)

c. The student is not female or did not receive a mechanical engineering degree.

82
views