


Ch. 3 - Probability
Larson - Elementary Statistics: Picturing the World 8th Edition
Larson8th EditionElementary Statistics: Picturing the WorldISBN: 9780137493470당신이 사용하는 게 아니라요?교과서 변경
3장, 문제 3.3.20d

Marijuana Use The percent distribution of the last marijuana use (either medical or nonmedical) for a sample of 13,373 college students is shown in the pie chart. Find the
probability of each event. (Source: American College Health Association)
d. Randomly selecting a student who has not used marijuana within the last 12 months

검증된 단계별 안내
1
Step 1: Understand the problem. We are tasked with finding the probability of randomly selecting a student who has not used marijuana within the last 12 months. This includes students who have 'Never' used marijuana and those who used it 'More than 1 year ago.'
Step 2: Identify the relevant data from the pie chart. The pie chart shows the percent distribution of marijuana use among college students. The percentage for 'Never' is 58.7%, and the percentage for 'More than 1 year ago' is 13.8%.
Step 3: Combine the probabilities for the relevant categories. Since both 'Never' and 'More than 1 year ago' represent students who have not used marijuana within the last 12 months, their probabilities should be added together.
Step 4: Convert the percentages to probabilities. To calculate probabilities, divide the percentages by 100. For example, the probability for 'Never' is 58.7/100, and for 'More than 1 year ago' is 13.8/100.
Step 5: Add the probabilities together. Sum the probabilities obtained in Step 4 to find the total probability of selecting a student who has not used marijuana within the last 12 months.

비슷한 문제에 대한 검증된 영상 답변:

이 영상 해법은 위 문제에 도움이 된다고 튜터들이 추천한 것입니다.
영상 길이:
2m
도움이 되었나요?

주요 개념

질문에 올바르게 답하기 위해 반드시 이해해야 하는 핵심 개념들은 다음과 같습니다.

Probability

Probability is a measure of the likelihood that a particular event will occur, expressed as a number between 0 and 1. In this context, it refers to the chance of randomly selecting a student from the sample who has not used marijuana in the last 12 months. This can be calculated by dividing the number of students who fall into that category by the total number of students surveyed.
추천 영상:
가이드 코스
5:37
Introduction to Probability

Percent Distribution

Percent distribution is a way of representing data in terms of percentages, showing how a total is divided among different categories. In the pie chart provided, each segment represents the percentage of students who last used marijuana within specific time frames, allowing for a visual understanding of the data distribution among the categories.
추천 영상:
가이드 코스
06:38
Intro to Frequency Distributions

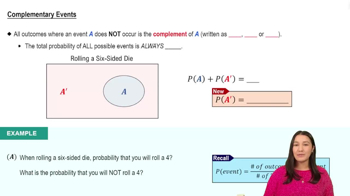
Complementary Events

Complementary events are pairs of outcomes in probability that cover all possible outcomes of a situation. In this case, the event of selecting a student who has not used marijuana in the last 12 months is complementary to the event of selecting a student who has used marijuana within that time frame. Understanding this concept helps in calculating the probability of the desired event by considering the total distribution.
추천 영상:
가이드 코스
4:23
Complementary Events