



Ch. 4 - Discrete Probability Distributions
Larson - Elementary Statistics: Picturing the World 8th Edition
Larson8th EditionElementary Statistics: Picturing the WorldISBN: 9780137493470당신이 사용하는 게 아니라요?교과서 변경
4장, 문제 4.Real.1b

The Centers for Disease Control and Prevention (CDC) is required by law to publish a report on assisted reproductive technology (ART). ART includes all fertility treatments in which both the egg and the sperm are used. These procedures generally involve removing eggs from a patient’s ovaries, combining them with sperm in the laboratory, and returning them to the patient’s body or giving them to another patient.
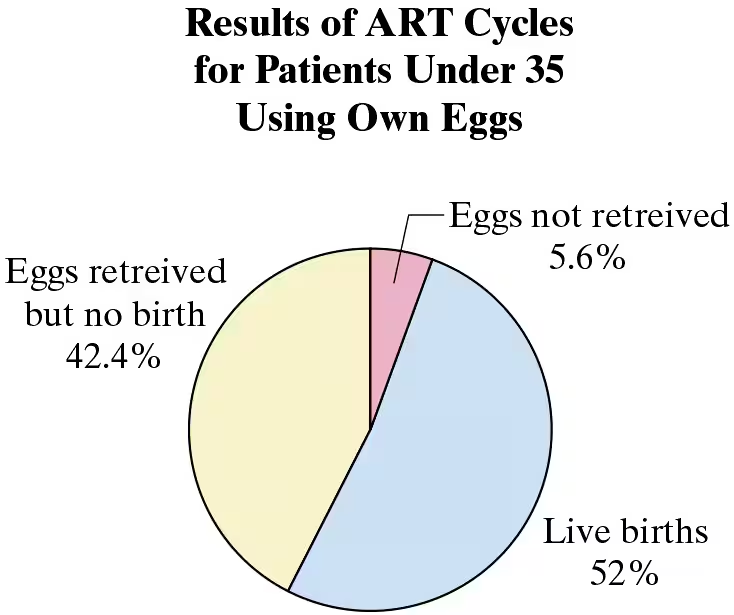
Pie chart showing ART cycle results for patients under 35: 52% live births, 42.4% eggs retrieved but no birth, 5.6% eggs not retrieved.
You are helping to prepare a CDC report on young ART patients and select at random 6 ART cycles of patients under 35 years of age for a special review. None of the cycles resulted in a live birth. Your manager feels it is impossible to select at random 10 ART cycles that do not result in a live birth. Use the pie chart at the right and your knowledge of statistics to determine whether your manager is correct.
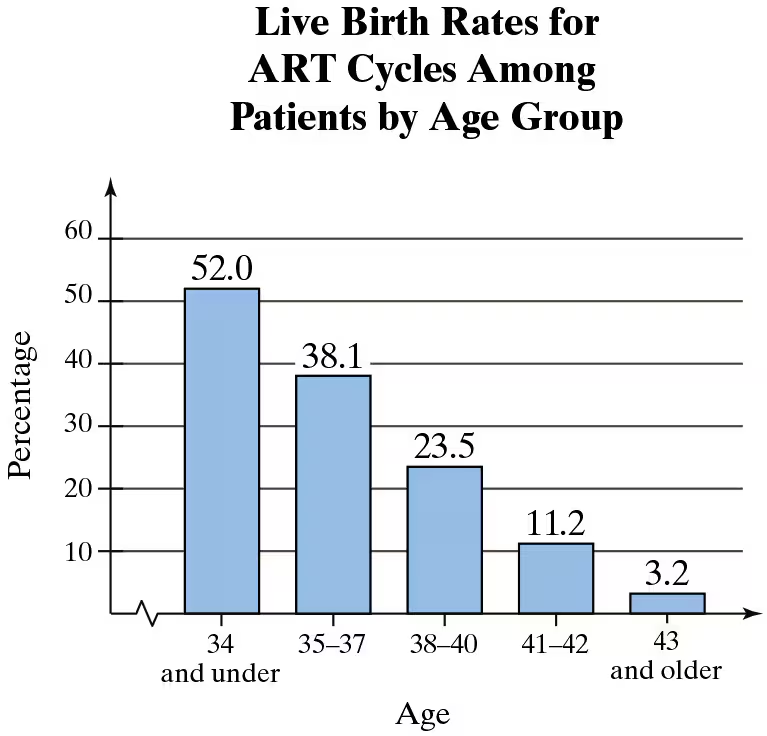
Bar chart showing live birth rates for ART cycles by age group, with percentages decreasing from 52% for patients 34 and under to 3.2% for 43 and older.
b. What probability distribution do you think best describes the situation? Do you think the distribution of the number of live births is discrete or continuous? Explain your reasoning.

검증된 단계별 안내
1
Step 1: Analyze the pie chart provided. The pie chart shows the outcomes of ART cycles for patients under 35 using their own eggs. The proportions are: 52% resulted in live births, 42.4% resulted in eggs retrieved but no birth, and 5.6% resulted in eggs not retrieved.
Step 2: Consider the manager's claim about selecting 10 ART cycles that do not result in live births. The probability of an ART cycle not resulting in a live birth is the sum of the probabilities for 'eggs retrieved but no birth' and 'eggs not retrieved,' which is 42.4% + 5.6% = 48%.
Step 3: Use the binomial probability distribution to model the situation. The binomial distribution is appropriate because we are dealing with a fixed number of trials (ART cycles), each with two possible outcomes: live birth or no live birth. The probability of no live birth is 48%, and the probability of live birth is 52%.
Step 4: Determine whether the distribution of the number of live births is discrete or continuous. The number of live births is a countable quantity (e.g., 0, 1, 2, etc.), which makes it a discrete random variable. Continuous variables, on the other hand, represent measurements that can take any value within a range.
Step 5: To assess the manager's claim, calculate the probability of selecting 10 ART cycles where none result in live births using the binomial formula: \( P(X = 0) = \binom{n}{x} p^x (1-p)^{n-x} \), where \( n = 10 \), \( x = 0 \), and \( p = 0.48 \). This calculation will show whether the manager's claim is statistically valid.

비슷한 문제에 대한 검증된 영상 답변:

이 영상 해법은 위 문제에 도움이 된다고 튜터들이 추천한 것입니다.
영상 길이:
5m
도움이 되었나요?

주요 개념

질문에 올바르게 답하기 위해 반드시 이해해야 하는 핵심 개념들은 다음과 같습니다.

Probability Distribution

A probability distribution describes how the probabilities of a random variable are distributed across its possible values. In this context, the number of live births from ART cycles can be modeled using a discrete probability distribution, as it counts distinct outcomes (0, 1, 2, etc.) rather than measuring a continuous range. Understanding this concept is crucial for analyzing the likelihood of different outcomes in ART cycles.
추천 영상:
가이드 코스
06:39
Calculating Probabilities in a Binomial Distribution

Discrete vs. Continuous Variables

Discrete variables are those that can take on a countable number of distinct values, such as the number of live births in ART cycles, which can only be whole numbers. In contrast, continuous variables can take on any value within a range. Recognizing the nature of the variable in question helps determine the appropriate statistical methods and probability distributions to apply.
추천 영상:
가이드 코스
04:48
Variance & Standard Deviation of Discrete Random Variables

Random Sampling

Random sampling is a technique used to select a subset of individuals from a larger population, ensuring that each individual has an equal chance of being chosen. This method is essential for making valid inferences about the population based on the sample. In the context of the ART cycles, understanding random sampling is key to evaluating the manager's claim about the feasibility of selecting cycles that do not result in live births.
추천 영상:
05:11
Sampling Distribution of Sample Proportion
관련 실천
교과서 질문

The Centers for Disease Control and Prevention (CDC) is required by law to publish a report on assisted reproductive technology (ART). ART includes all fertility treatments in which both the egg and the sperm are used. These procedures generally involve removing eggs from a patient’s ovaries, combining them with sperm in the laboratory, and returning them to the patient’s body or giving them to another patient.

You are helping to prepare a CDC report on young ART patients and select at random 6 ART cycles of patients under 35 years of age for a special review. None of the cycles resulted in a live birth. Your manager feels it is impossible to select at random 10 ART cycles that do not result in a live birth. Use the pie chart at the right and your knowledge of statistics to determine whether your manager is correct.

a. How would you determine whether your manager is correct, that it is impossible to select at random six ART cycles that do not result in a live birth?

86
views
교과서 질문

In Exercises 1–3, find the indicated probabilities using the geometric distribution, the Poisson distribution, or the binomial distribution. Then determine whether the events are unusual. If convenient, use a table or technology to find the probabilities.

One out of every 42 tax returns for incomes over \$1 million requires an audit. An auditor is examining tax returns for over \$1 million. Find the probability that (b) the first return requiring an audit is the first or second return the tax auditor examines, 

88
views
교과서 질문

In Exercises 13–16, find the indicated binomial probabilities. If convenient, use technology or Table 2 in Appendix B.

Fifty-three percent of U.S. adults support attempting to land an astronaut on Mars. You randomly select eight U.S. adults. Find the probability that the number who support attempting to land an astronaut on Mars is (a) exactly three

128
views
교과서 질문

In Exercises 1–7, consider a grocery store that can process a total of four customers at its checkout counters each minute.

Minitab was used to generate 20 random numbers with a Poisson distribution for . Let the random number represent the number of arrivals at the checkout counter each minute for 20 minutes. 3 3 3 3 5 5 6 7 3 6 3 5 6 3 4 6 2 2 4 1During each of the first four minutes, only three customers arrived. These customers could all be processed, so there were no customers waiting after four minutes.

b. Create a table that shows the number of customers waiting at the end of 1 through 20 minutes.

81
views
교과서 질문

In Exercises 13–16, find the indicated binomial probabilities. If convenient, use technology or Table 2 in Appendix B.

Fifty-three percent of U.S. adults support attempting to land an astronaut on Mars. You randomly select eight U.S. adults. Find the probability that the number who support attempting to land an astronaut on Mars is (c) more than three.

85
views
교과서 질문

In Exercises 1–7, consider a grocery store that can process a total of four customers at its checkout counters each minute.

The mean number of arrivals per minute is four. Find the probability that

c. more than four customers will arrive during each of the first four minutes.

79
views