


Ch. 5 - Normal Probability Distributions
Larson - Elementary Statistics: Picturing the World 8th Edition
Larson8th EditionElementary Statistics: Picturing the WorldISBN: 9780137493470당신이 사용하는 게 아니라요?교과서 변경
5장, 문제 5.RS.1b

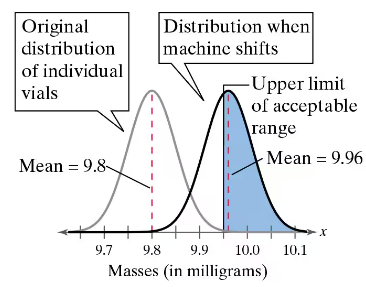
Assume the machine shifts and the distribution of the amount of the compound added now has a mean of 9.96 milligrams and a standard deviation of 0.05 milligram. You select one vial and determine how much of the compound was added.

b. You randomly select 15 vials. What is the probability that you select at least one vial that is within the acceptable range?

검증된 단계별 안내
1
Step 1: Understand the problem. The machine has shifted, and the new distribution of the compound added to vials has a mean of 9.96 milligrams and a standard deviation of 0.05 milligrams. You are tasked with finding the probability of selecting at least one vial within the acceptable range when randomly selecting 15 vials.
Step 2: Define the acceptable range. From the graph, the upper limit of the acceptable range is clearly marked. You need to determine the z-score for the upper limit using the formula: z=x-μσ, where x is the upper limit, μ is the mean, and σ is the standard deviation.
Step 3: Calculate the probability for one vial being within the acceptable range. Use the z-score obtained in Step 2 to find the corresponding cumulative probability from the standard normal distribution table. This gives the probability of a single vial being within the acceptable range.
Step 4: Use the complement rule to find the probability of a vial being outside the acceptable range. Subtract the probability of being within the range from 1. This gives the probability of a single vial being outside the range.
Step 5: Calculate the probability of at least one vial being within the acceptable range when selecting 15 vials. Use the formula for the complement of the binomial probability: P(at least 1 vial within range)=1-(probability of being outside)15. This formula accounts for the probability of all 15 vials being outside the range.

비슷한 문제에 대한 검증된 영상 답변:

이 영상 해법은 위 문제에 도움이 된다고 튜터들이 추천한 것입니다.
영상 길이:
6m

주요 개념

질문에 올바르게 답하기 위해 반드시 이해해야 하는 핵심 개념들은 다음과 같습니다.

Normal Distribution

Normal distribution is a probability distribution that is symmetric about the mean, showing that data near the mean are more frequent in occurrence than data far from the mean. It is characterized by its bell-shaped curve, defined by its mean and standard deviation. In this context, the distribution of the compound amounts in vials follows a normal distribution, which is crucial for calculating probabilities related to the selected vials.
추천 영상:
가이드 코스
06:23
Using the Normal Distribution to Approximate Binomial Probabilities

Standard Deviation

Standard deviation is a measure of the amount of variation or dispersion in a set of values. A low standard deviation indicates that the values tend to be close to the mean, while a high standard deviation indicates that the values are spread out over a wider range. In this scenario, the standard deviation of 0.05 milligrams indicates how much the amounts of the compound in the vials vary from the mean of 9.96 milligrams.
추천 영상:
가이드 코스
08:45
Calculating Standard Deviation

Probability of Events

Probability is a measure of the likelihood that an event will occur, expressed as a number between 0 and 1. In this question, we are interested in the probability of selecting at least one vial within an acceptable range from a sample of 15 vials. This involves calculating the complement of the probability of selecting no vials within that range, which can be derived from the normal distribution properties and the z-scores corresponding to the acceptable limits.
추천 영상:
가이드 코스
05:54
Probability of Multiple Independent Events
관련 실천
교과서 질문

Assume the machine shifts and is filling the vials with a mean amount of 9.96 milligrams and a standard deviation of 0.05 milligram. You select five vials and find the mean amount of compound added.


c. Which is more sensitive to a shift of parameters—an individual random selection or a randomly selected sample mean?

79
views
교과서 질문

In Exercises 1 and 2, use the normal curve to estimate the mean and standard deviation.


106
views
교과서 질문

In Exercises 5 and 6, find the area of the indicated region under the standard normal curve. If convenient, use technology to find the area.


73
views
교과서 질문

Assume the machine shifts and the distribution of the amount of the compound added now has a mean of 9.96 milligrams and a standard deviation of 0.05 milligram. You select one vial and determine how much of the compound was added.


a. What is the probability that you select a vial that is within the acceptable range (in other words, you do not detect that the machine has shifted)? (See figure.)

76
views
교과서 질문

Assume the machine shifts and is filling the vials with a mean amount of 9.96 milligrams and a standard deviation of 0.05 milligram. You select five vials and find the mean amount of compound added.


b. You randomly select three samples of five vials. What is the probability that you select at least one sample of five vials that has a mean that is within the acceptable range?


40
views
교과서 질문

In Exercises 7–18, find the indicated area under the standard normal curve. If convenient, use technology to find the area.


To the left of z = -1.95

91
views