
교과서 질문
In Exercises 1 and 2, use the normal curve to estimate the mean and standard deviation.
106
views

 검증된 단계별 안내

 09:47
09:47
 06:31
06:31 08:50
08:50In Exercises 1 and 2, use the normal curve to estimate the mean and standard deviation.
Assume the machine shifts and the distribution of the amount of the compound added now has a mean of 9.96 milligrams and a standard deviation of 0.05 milligram. You select one vial and determine how much of the compound was added.
b. You randomly select 15 vials. What is the probability that you select at least one vial that is within the acceptable range?
Assume the machine shifts and is filling the vials with a mean amount of 9.96 milligrams and a standard deviation of 0.05 milligram. You select five vials and find the mean amount of compound added.
b. You randomly select three samples of five vials. What is the probability that you select at least one sample of five vials that has a mean that is within the acceptable range?
In Exercises 27–32, the random variable x is normally distributed with mean mu=74 and standard deviation sigma=8. Find the indicated probability.
P(72 < x < 82)
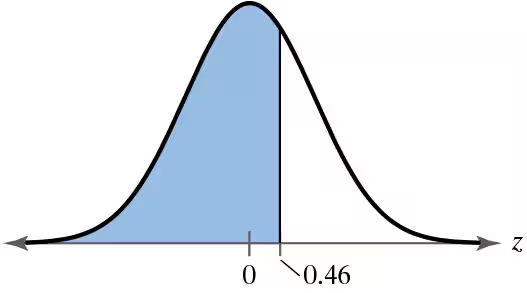
In Exercises 7–18, find the indicated area under the standard normal curve. If convenient, use technology to find the area.
To the left of z = -1.95
In Exercises 21–26, find the indicated probability using the standard normal distribution. If convenient, use technology to find the probability.
P(z < 1.28)