Ch. 6 - Confidence Intervals
Larson - Elementary Statistics: Picturing the World 8th Edition
Larson8th EditionElementary Statistics: Picturing the WorldISBN: 9780137493470당신이 사용하는 게 아니라요?교과서 변경
6장, 문제 6.1.17

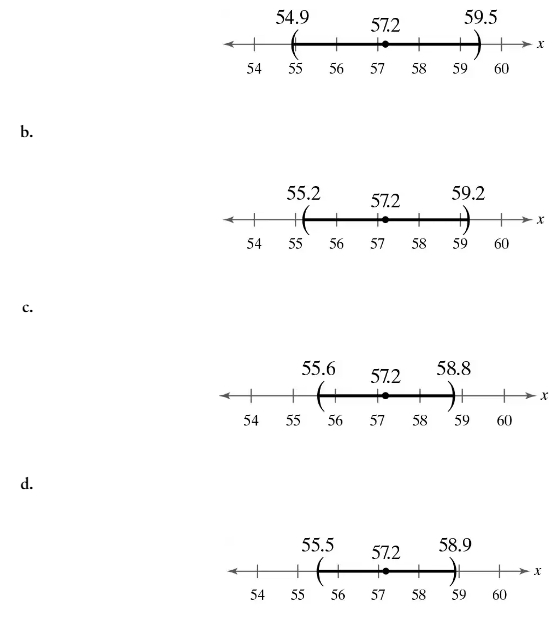
Matching In Exercises 17–20, match the level of confidence c with the appropriate confidence interval. Assume each confidence interval is constructed for the same sample statistics.
c = 0.88
Four horizontal number lines displaying confidence intervals for a population mean, with specific values marked on each line.

검증된 단계별 안내
1
Step 1: Understand the concept of confidence intervals. A confidence interval provides a range of values that is likely to contain the population parameter (e.g., mean) with a certain level of confidence. Higher confidence levels result in wider intervals, while lower confidence levels result in narrower intervals.
Step 2: Analyze the given confidence intervals in the images. Each interval is centered around the same sample statistic (57.2), but the width of the intervals varies. Wider intervals correspond to higher confidence levels, and narrower intervals correspond to lower confidence levels.
Step 3: Recall that the confidence level c = 0.88 is relatively low compared to common levels like 0.95 or 0.99. Therefore, the interval associated with c = 0.88 should be narrower than those for higher confidence levels.
Step 4: Compare the intervals in the images. The interval in option 'c' (55.6 to 58.8) is narrower than the intervals in options 'a' and 'b', but slightly wider than the interval in option 'd'. This suggests that option 'c' is likely to correspond to c = 0.88.
Step 5: Match the confidence level c = 0.88 with the appropriate interval. Based on the analysis, the interval in option 'c' (55.6 to 58.8) is the best match for c = 0.88.

비슷한 문제에 대한 검증된 영상 답변:

이 영상 해법은 위 문제에 도움이 된다고 튜터들이 추천한 것입니다.
영상 길이:
2m
도움이 되었나요?

주요 개념

질문에 올바르게 답하기 위해 반드시 이해해야 하는 핵심 개념들은 다음과 같습니다.

Confidence Interval

A confidence interval is a range of values derived from sample statistics that is likely to contain the true population parameter. It is expressed as an interval estimate, typically calculated using the sample mean and a margin of error, which is influenced by the desired confidence level. For example, a 95% confidence interval suggests that if we were to take many samples, approximately 95% of the calculated intervals would contain the true mean.
추천 영상:
가이드 코스
06:33
Introduction to Confidence Intervals

Confidence Level (c)

The confidence level, denoted as 'c', represents the probability that the confidence interval will contain the true population parameter. Common confidence levels include 90%, 95%, and 99%. A higher confidence level results in a wider interval, reflecting greater uncertainty about the exact value of the parameter. In this case, a confidence level of 0.88 indicates that we expect the true mean to fall within the interval 88% of the time.
추천 영상:
가이드 코스
06:33
Introduction to Confidence Intervals

Margin of Error

The margin of error is the amount of error that is allowed in the estimation of a population parameter. It is calculated based on the standard error of the sample and the critical value associated with the desired confidence level. A larger margin of error results in a wider confidence interval, which can provide more assurance that the interval captures the true parameter, but may also reduce the precision of the estimate.
추천 영상:
가이드 코스
04:08
Finding the Minimum Sample Size Needed for a Confidence Interval