Ch. 6 - Confidence Intervals
Larson - Elementary Statistics: Picturing the World 8th Edition
Larson8th EditionElementary Statistics: Picturing the WorldISBN: 9780137493470당신이 사용하는 게 아니라요?교과서 변경
6장, 문제 6.3.1

True or False? In Exercises 1 and 2, determine whether the statement is true or false. If it is false, rewrite it as a true statement.
The point estimate for the population proportion of failures is 1-p^

검증된 단계별 안내
1
Understand the problem: The statement is about the point estimate for the population proportion of failures. Recall that the population proportion of successes is denoted by p, and the population proportion of failures is complementary to this, represented as 1 - p.
Review the concept: The point estimate for the population proportion of failures is derived from the complement of the population proportion of successes. If p represents the proportion of successes, then 1 - p represents the proportion of failures.
Analyze the statement: The statement claims that the point estimate for the population proportion of failures is 1 - p^ (where p^ is the sample proportion of successes). This aligns with the definition of the complement rule in probability.
Determine the truth value: Since the statement correctly describes the relationship between the sample proportion of successes (p^) and the sample proportion of failures (1 - p^), the statement is true.
Conclude: The statement is true, and no rewriting is necessary. If the statement were false, you would need to correct it by ensuring the complement relationship is properly stated as 1 - p^ for the sample proportion of failures.

비슷한 문제에 대한 검증된 영상 답변:

이 영상 해법은 위 문제에 도움이 된다고 튜터들이 추천한 것입니다.
영상 길이:
1m
도움이 되었나요?

주요 개념

질문에 올바르게 답하기 위해 반드시 이해해야 하는 핵심 개념들은 다음과 같습니다.

Point Estimate

A point estimate is a single value that serves as an approximation of a population parameter. In statistics, it is often derived from sample data and is used to infer characteristics about the entire population. For example, the sample mean is a point estimate of the population mean.
추천 영상:
06:33
Introduction to Confidence Intervals

Population Proportion

The population proportion refers to the fraction of a population that possesses a certain characteristic. It is denoted by 'p' and is crucial in understanding the distribution of categorical data. For instance, if 30 out of 100 surveyed individuals prefer a certain product, the population proportion of preference is 0.3.
추천 영상:
05:45
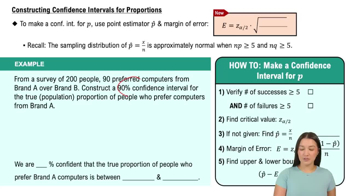
Constructing Confidence Intervals for Proportions

Complement of a Proportion

The complement of a proportion is the probability that an event does not occur, calculated as 1 minus the proportion of the event. In the context of failures, if 'p' represents the proportion of successes, then '1 - p' represents the proportion of failures. This concept is essential for accurately interpreting and calculating probabilities in statistical analysis.
추천 영상:
가이드 코스
08:09
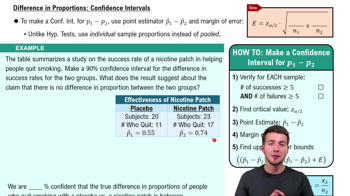
Difference in Proportions: Confidence Intervals