


Graphical Analysis In Exercises 11–14, determine whether there is a perfect positive linear correlation, a strong positive linear correlation, a perfect negative linear correlation, a strong negative linear correlation, or no linear correlation between the variables.
Ch. 9 - Correlation and Regression
Larson8th EditionElementary Statistics: Picturing the WorldISBN: 9780137493470당신이 사용하는 게 아니라요?교과서 변경
9장, 문제 9.2.5
5. To predict y-values using the equation of a regression line, what must be true about the correlation coefficient of the variables?
검증된 단계별 안내1
Understand the concept of the correlation coefficient: The correlation coefficient (denoted as r) measures the strength and direction of the linear relationship between two variables. It ranges from -1 to 1, where values close to -1 or 1 indicate a strong linear relationship, and values near 0 indicate a weak or no linear relationship.
Recognize the role of the regression line: The regression line is used to predict y-values based on x-values. For the predictions to be meaningful, there must be a significant linear relationship between the variables.
Ensure the correlation coefficient is not zero: If the correlation coefficient is close to zero, it implies that there is little to no linear relationship between the variables, making the regression line ineffective for prediction.
Check the strength of the correlation: A higher absolute value of the correlation coefficient (e.g., |r| > 0.7) indicates a stronger linear relationship, which makes the regression line more reliable for predicting y-values.
Verify the direction of the relationship: If r is positive, the regression line will have a positive slope, meaning y increases as x increases. If r is negative, the regression line will have a negative slope, meaning y decreases as x increases. This direction must align with the data for accurate predictions.

비슷한 문제에 대한 검증된 영상 답변:
이 영상 해법은 위 문제에 도움이 된다고 튜터들이 추천한 것입니다.
영상 길이:
2m도움이 되었나요?
주요 개념
질문에 올바르게 답하기 위해 반드시 이해해야 하는 핵심 개념들은 다음과 같습니다.
Correlation Coefficient
The correlation coefficient, denoted as 'r', quantifies the strength and direction of a linear relationship between two variables. It ranges from -1 to 1, where values close to 1 indicate a strong positive correlation, values close to -1 indicate a strong negative correlation, and values around 0 suggest no linear correlation. Understanding this coefficient is crucial for assessing how well one variable can predict another in regression analysis.
추천 영상:
가이드 코스
Correlation Coefficient
Regression Line
A regression line is a statistical tool used to model the relationship between a dependent variable (y) and one or more independent variables (x). It is represented by the equation y = mx + b, where 'm' is the slope and 'b' is the y-intercept. The accuracy of predictions made using this line is heavily influenced by the correlation coefficient, as a strong correlation indicates that the regression line will closely fit the data points.
추천 영상:
가이드 코스
Using Regression Lines to Predict Values
Predictive Validity
Predictive validity refers to the extent to which a model, such as a regression line, accurately predicts outcomes based on input variables. For the predictions to be reliable, the correlation coefficient must be significantly different from zero, indicating a meaningful relationship between the variables. High predictive validity ensures that changes in the independent variable lead to consistent changes in the dependent variable, making the model useful for forecasting.
추천 영상:
가이드 코스
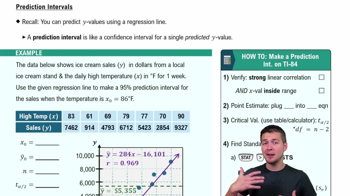
Prediction Intervals
관련 실천
교과서 질문
65
views
교과서 질문
"Old Vehicles In Exercises 31–34, use the figure shown at the left.
33. Coefficient of Determination Find the coefficient of determination r^2 and interpret the results."
48
views
교과서 질문
6. Discuss the difference between r and p.
331
views
교과서 질문
2. Describe the range of values for the correlation coefficient.
248
views
교과서 질문
"In Exercises 19-22, two variables are given that have been shown to have correlation but no cause-and-effect relationship. Describe at least one possible reason for the correlation.
22. Marriage rate in Kentucky and number of deaths caused by falling out of a fishing boat"
65
views
교과서 질문
In Exercise 23, add data for a child who is 6 years old and has a vocabulary of 900 words. Describe how this affects the correlation coefficient r.
54
views
