



Ch. 9 - Correlation and Regression
Larson - Elementary Statistics: Picturing the World 8th Edition
Larson8th EditionElementary Statistics: Picturing the WorldISBN: 9780137493470당신이 사용하는 게 아니라요?교과서 변경
9장, 문제 9.3.12a

"Finding the Coefficient of Determination and the Standard Error of Estimate In Exercises 11-20, use the data to (a) find the coefficient of determination r^2 and interpret the result,
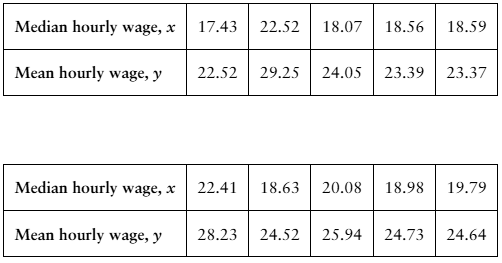
12. [APPLET] Median and Mean Hourly Wages The table shows the median and mean hourly wages (in dollars) in 10 states in a recent year. The equation of the regression line is y = 1.208x + 1.495. (Source: U.S. Census Bureau)
"

검증된 단계별 안내
1
Step 1: Understand the problem. You are tasked with finding the coefficient of determination (r^2) and interpreting the result. The coefficient of determination measures the proportion of the variance in the dependent variable (mean hourly wage, y) that is predictable from the independent variable (median hourly wage, x). Additionally, you need to calculate the standard error of estimate, which quantifies the accuracy of predictions made by the regression line.
Step 2: Use the regression equation provided, y = 1.208x + 1.495, to calculate the predicted values of y (mean hourly wage) for each given x (median hourly wage) in the table. Substitute each x value into the equation to find the corresponding predicted y value.
Step 3: Calculate the residuals for each data point. A residual is the difference between the actual y value and the predicted y value: residual = actual y - predicted y. Compute this for all data points in the table.
Step 4: Compute the coefficient of determination (r^2). First, calculate the total sum of squares (SST), which measures the total variation in the actual y values. Then, calculate the regression sum of squares (SSR), which measures the variation explained by the regression line. Finally, use the formula r^2 = SSR / SST to find the coefficient of determination.
Step 5: Calculate the standard error of estimate (SEE). Use the formula SEE = sqrt(SSE / (n - 2)), where SSE is the sum of squared residuals and n is the number of data points. This will give you the standard error of estimate, which indicates the average distance that the observed values fall from the regression line.

비슷한 문제에 대한 검증된 영상 답변:

이 영상 해법은 위 문제에 도움이 된다고 튜터들이 추천한 것입니다.
영상 길이:
5m
도움이 되었나요?

주요 개념

질문에 올바르게 답하기 위해 반드시 이해해야 하는 핵심 개념들은 다음과 같습니다.

Coefficient of Determination (r²)

The coefficient of determination, denoted as r², measures the proportion of variance in the dependent variable that can be explained by the independent variable in a regression model. It ranges from 0 to 1, where 0 indicates no explanatory power and 1 indicates perfect prediction. A higher r² value suggests a stronger relationship between the variables, allowing for better predictions.
추천 영상:
가이드 코스
06:14
Coefficient of Determination

Standard Error of Estimate

The standard error of estimate quantifies the accuracy of predictions made by a regression model. It represents the average distance that the observed values fall from the regression line. A smaller standard error indicates that the data points are closer to the predicted values, suggesting a more reliable model, while a larger standard error indicates greater variability and less precision in predictions.
추천 영상:
가이드 코스
08:45
Calculating Standard Deviation

Regression Line

A regression line is a straight line that best fits the data points in a scatter plot, representing the relationship between the independent variable (x) and the dependent variable (y). The equation of the regression line, typically in the form y = mx + b, where m is the slope and b is the y-intercept, allows for predictions of y based on given values of x. Understanding the regression line is crucial for interpreting the results of regression analysis.
추천 영상:
가이드 코스
04:57
Using Regression Lines to Predict Values
관련 실천
교과서 질문

Writing Use an appropriate research source to find a real-life data set with the indicated cause-and-effect relationship. Write a paragraph describing each variable and explain why you think the variables have the indicated cause-and-effect relationship.

a. Direct Cause-and-Effect: Changes in one variable cause changes in the other variable.

74
views
교과서 질문

"[APPLET] For Exercises 2–9, use the data in the table, which shows the average annual salaries (both in thousands of dollars) for librarians and postsecondary library science teachers in the United States for 12 years. (Source: U.S. Bureau of Labor Statistics)

7. Find the coefficient of determination r^2 and interpret the result."

77
views
교과서 질문

"Finding the Coefficient of Determination and the Standard Error of Estimate In Exercises 11-20, use the data to (b) find the standard error of estimate s_e and interpret the result.

12. [APPLET] Median and Mean Hourly Wages The table shows the median and mean hourly wages (in dollars) in 10 states in a recent year. The equation of the regression line is y = 1.208x + 1.495. (Source: U.S. Census Bureau)

"

106
views
교과서 질문

"[APPLET] For Exercises 2–9, use the data in the table, which shows the average annual salaries (both in thousands of dollars) for librarians and postsecondary library science teachers in the United States for 12 years. (Source: U.S. Bureau of Labor Statistics)

6. Use the regression equation that you found in Exercise 5 to predict the average annual salary of postsecondary library science teachers when the average annual salary of librarians is \$61,000."

49
views
교과서 질문

Writing Use an appropriate research source to find a real-life data set with the indicated cause-and-effect relationship. Write a paragraph describing each variable and explain why you think the variables have the indicated cause-and-effect relationship.

b. Other Factors: The relationship between the variables is caused by a third variable.

45
views
교과서 질문

Writing Use an appropriate research source to find a real-life data set with the indicated cause-and-effect relationship. Write a paragraph describing each variable and explain why you think the variables have the indicated cause-and-effect relationship.

c. Coincidence: The relationship between the variables is a coincidence.

37
views