



Ch. 9 - Correlation and Regression
Larson - Elementary Statistics: Picturing the World 8th Edition
Larson8th EditionElementary Statistics: Picturing the WorldISBN: 9780137493470당신이 사용하는 게 아니라요?교과서 변경
9장, 문제 9.3.12b

"Finding the Coefficient of Determination and the Standard Error of Estimate In Exercises 11-20, use the data to (b) find the standard error of estimate s_e and interpret the result.
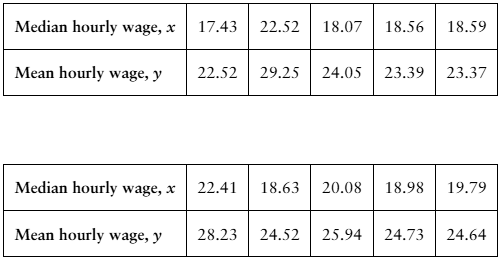
12. [APPLET] Median and Mean Hourly Wages The table shows the median and mean hourly wages (in dollars) in 10 states in a recent year. The equation of the regression line is y = 1.208x + 1.495. (Source: U.S. Census Bureau)
"

검증된 단계별 안내
1
Step 1: Understand the problem. You are tasked with finding the standard error of estimate (s_e) using the given data and interpreting the result. The regression equation provided is y = 1.208x + 1.495, where x represents the median hourly wage and y represents the mean hourly wage.
Step 2: Calculate the predicted values (ŷ) for each x value using the regression equation. Substitute each x value from the table into the equation y = 1.208x + 1.495 to compute the corresponding predicted y values.
Step 3: Compute the residuals for each data point. The residual for each data point is calculated as the difference between the observed y value and the predicted y value: residual = y - ŷ.
Step 4: Square each residual and sum them up. This gives the sum of squared residuals (SSR), which is a measure of the total deviation of the observed values from the predicted values.
Step 5: Use the formula for the standard error of estimate: s_e = sqrt(SSR / (n - 2)), where n is the number of data points. Divide the SSR by (n - 2) and take the square root to find s_e. Interpret the result as the average distance that the observed values fall from the regression line.

비슷한 문제에 대한 검증된 영상 답변:

이 영상 해법은 위 문제에 도움이 된다고 튜터들이 추천한 것입니다.
영상 길이:
3m
도움이 되었나요?

주요 개념

질문에 올바르게 답하기 위해 반드시 이해해야 하는 핵심 개념들은 다음과 같습니다.

Coefficient of Determination (R²)

The Coefficient of Determination, denoted as R², measures the proportion of variance in the dependent variable that can be predicted from the independent variable. It ranges from 0 to 1, where 0 indicates no explanatory power and 1 indicates perfect prediction. A higher R² value suggests a stronger relationship between the variables, making it essential for evaluating the effectiveness of a regression model.
추천 영상:
가이드 코스
06:14
Coefficient of Determination

Standard Error of Estimate (s_e)

The Standard Error of Estimate (s_e) quantifies the accuracy of predictions made by a regression model. It represents the average distance that the observed values fall from the regression line. A smaller s_e indicates that the data points are closer to the predicted values, reflecting a more reliable model. It is calculated using the residuals, which are the differences between observed and predicted values.
추천 영상:
가이드 코스
08:45
Calculating Standard Deviation

Regression Line

A regression line is a straight line that best fits the data points in a scatter plot, representing the relationship between the independent variable (x) and the dependent variable (y). The equation of the regression line, typically in the form y = mx + b, includes a slope (m) and y-intercept (b). In this context, the regression line helps to predict mean hourly wages based on median hourly wages, providing insights into wage trends.
추천 영상:
가이드 코스
04:57
Using Regression Lines to Predict Values
관련 실천
교과서 질문

"Finding the Coefficient of Determination and the Standard Error of Estimate In Exercises 11-20, use the data to (a) find the coefficient of determination r^2 and interpret the result,

12. [APPLET] Median and Mean Hourly Wages The table shows the median and mean hourly wages (in dollars) in 10 states in a recent year. The equation of the regression line is y = 1.208x + 1.495. (Source: U.S. Census Bureau)

"

163
views
교과서 질문

Writing Use an appropriate research source to find a real-life data set with the indicated cause-and-effect relationship. Write a paragraph describing each variable and explain why you think the variables have the indicated cause-and-effect relationship.

a. Direct Cause-and-Effect: Changes in one variable cause changes in the other variable.

74
views
교과서 질문

Writing Use an appropriate research source to find a real-life data set with the indicated cause-and-effect relationship. Write a paragraph describing each variable and explain why you think the variables have the indicated cause-and-effect relationship.

b. Other Factors: The relationship between the variables is caused by a third variable.

45
views
교과서 질문

Writing Use an appropriate research source to find a real-life data set with the indicated cause-and-effect relationship. Write a paragraph describing each variable and explain why you think the variables have the indicated cause-and-effect relationship.

c. Coincidence: The relationship between the variables is a coincidence.

37
views