Ch. 9 - Correlation and Regression
Larson - Elementary Statistics: Picturing the World 8th Edition
Larson8th EditionElementary Statistics: Picturing the WorldISBN: 9780137493470당신이 사용하는 게 아니라요?교과서 변경
9장, 문제 9.3.1

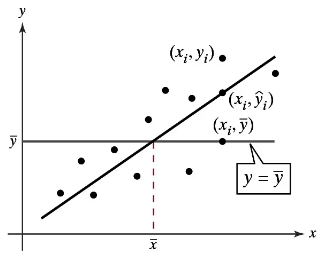
"Graphical Analysis In Exercises 1–3, use the figure.

1. Describe the total variation about a regression line in words and in symbols."

검증된 단계별 안내
1
Step 1: Understand the concept of total variation in the context of regression. Total variation measures how much the observed values (y_i) vary around the mean of y (denoted as \( \bar{y} \)).
Step 2: Express total variation symbolically as the sum of squared differences between each observed value and the mean of y: \( \text{Total Variation} = \sum (y_i - \bar{y})^2 \). This represents the total amount of variability in the response variable y.
Step 3: Recognize that the total variation can be decomposed into two parts: the variation explained by the regression line (explained variation) and the variation not explained by the regression line (residual or unexplained variation).
Step 4: The explained variation is the sum of squared differences between the predicted values \( \hat{y}_i \) and the mean \( \bar{y} \), written as \( \sum (\hat{y}_i - \bar{y})^2 \). This shows how much of the total variation is accounted for by the regression model.
Step 5: The residual variation is the sum of squared differences between the observed values and the predicted values, \( \sum (y_i - \hat{y}_i)^2 \), representing the variation that the regression line does not explain.

비슷한 문제에 대한 검증된 영상 답변:

이 영상 해법은 위 문제에 도움이 된다고 튜터들이 추천한 것입니다.
영상 길이:
3m
도움이 되었나요?

주요 개념

질문에 올바르게 답하기 위해 반드시 이해해야 하는 핵심 개념들은 다음과 같습니다.

Total Variation in Regression

Total variation measures the overall variability of the observed data points around the mean of the dependent variable (ȳ). It quantifies how spread out the y-values are before considering any explanatory variables, representing the total sum of squared differences between each observed yᵢ and the mean ȳ.
추천 영상:
가이드 코스
07:01
Intro to Least Squares Regression

Regression Line and Predicted Values

The regression line represents the predicted relationship between the independent variable x and the dependent variable y. Each predicted value ŷᵢ lies on this line and estimates the mean response for a given xᵢ, helping to explain part of the total variation in y by accounting for the effect of x.
추천 영상:
가이드 코스
04:57
Using Regression Lines to Predict Values

Decomposition of Total Variation

Total variation can be decomposed into explained variation (variation due to the regression line) and unexplained variation (residuals). Symbolically, total sum of squares (SST) = regression sum of squares (SSR) + error sum of squares (SSE), which helps assess how well the regression model fits the data.
추천 영상:
가이드 코스
06:14
Coefficient of Determination
관련 실천
교과서 질문

3. What does the sample correlation coefficient r measure? Which value indicates a stronger correlation: r =0.918 or r =- 0.932? Explain your reasoning.

199
views

교과서 질문

In Exercise 24, remove the data for the student who is 57 inches tall and scored 128 on the IQ test. Describe how this affects the correlation coefficient r.

42
views
교과서 질문

"In Exercises 9 and 10, identify the explanatory variable and the response variable.

10. An actuary at an insurance company wants to determine whether the number of hours of safety driving classes can be used to predict the number of driving accidents for each

driver."

102
views
교과서 질문

Graphical Analysis In Exercises 11–14, determine whether there is a perfect positive linear correlation, a strong positive linear correlation, a perfect negative linear correlation, a strong negative linear correlation, or no linear correlation between the variables.

46
views
교과서 질문

"Constructing and Interpreting a Prediction Interval In Exercises 21-30, construct the indicated prediction interval and interpret the results.

22. Mean Hourly Wage Construct a 95% prediction interval for the mean hourly wage in Exercise 12 when the median hourly wage is \$21.50."

53
views
교과서 질문

"In Exercises 7-10, use the value of the correlation coefficient r to calculate the coefficient of determination r^2. What does this tell you about the explained variation of the data about the regression line? about the unexplained variation?

8.r =- 0.328"

71
views