



Ch. 9 - Correlation and Regression
Larson - Elementary Statistics: Picturing the World 8th Edition
Larson8th EditionElementary Statistics: Picturing the WorldISBN: 9780137493470당신이 사용하는 게 아니라요?교과서 변경
9장, 문제 9.3.3

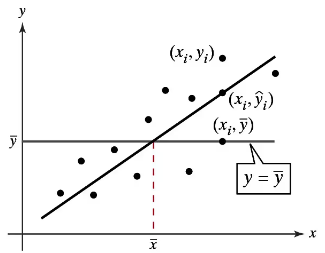
"Graphical Analysis In Exercises 1–3, use the figure.
Scatter plot showing data points, a regression line, and annotations for residuals and average values.
Describe the unexplained variation about a regression line in words and in symbols."

검증된 단계별 안내
1
The unexplained variation about a regression line refers to the differences between the observed values (yᵢ) and the predicted values (ŷᵢ) for each data point. This difference is also known as the residual.
In the scatter plot, the residual for a data point is represented by the vertical distance between the observed value (yᵢ) and the predicted value (ŷᵢ) on the regression line.
Mathematically, the residual for the i-th data point is expressed as: rᵢ = yᵢ - ŷᵢ, where yᵢ is the observed value and ŷᵢ is the predicted value from the regression line.
The unexplained variation is the sum of the squared residuals across all data points, which is used to measure how well the regression line fits the data. This is expressed as: Σ(yᵢ - ŷᵢ)².
In words, the unexplained variation quantifies the portion of the total variation in the dependent variable (y) that is not accounted for by the regression model.

비슷한 문제에 대한 검증된 영상 답변:

이 영상 해법은 위 문제에 도움이 된다고 튜터들이 추천한 것입니다.
영상 길이:
3m
도움이 되었나요?

주요 개념

질문에 올바르게 답하기 위해 반드시 이해해야 하는 핵심 개념들은 다음과 같습니다.

Regression Line

A regression line is a statistical tool used to model the relationship between a dependent variable and one or more independent variables. It represents the best fit line through a scatter plot of data points, minimizing the distance between the points and the line. The equation of the regression line can be expressed as y = mx + b, where m is the slope and b is the y-intercept.
추천 영상:
가이드 코스
04:57
Using Regression Lines to Predict Values

Residuals

Residuals are the differences between the observed values and the values predicted by the regression line. They are calculated as e_i = y_i - ŷ_i, where y_i is the actual value and ŷ_i is the predicted value. Analyzing residuals helps assess the accuracy of the regression model and identify any patterns that may indicate a poor fit.
추천 영상:
가이드 코스
07:38
Residuals and Residual Plots

Unexplained Variation

Unexplained variation refers to the portion of the total variation in the dependent variable that cannot be accounted for by the regression model. It is represented by the sum of the squared residuals and indicates how much of the variability in the data remains after fitting the model. Understanding unexplained variation is crucial for evaluating the effectiveness of the regression analysis.
추천 영상:
가이드 코스
06:14
Coefficient of Determination