


Ch. 9 - Correlation and Regression
Larson - Elementary Statistics: Picturing the World 8th Edition
Larson8th EditionElementary Statistics: Picturing the WorldISBN: 9780137493470당신이 사용하는 게 아니라요?교과서 변경
9장, 문제 9.3.34

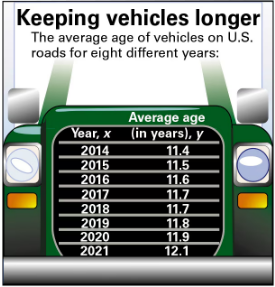
"Old Vehicles In Exercises 31–34, use the figure shown at the left.
Table showing the average age of vehicles on U.S. roads from 2014 to 2021, with years and corresponding ages in years.
Error of Estimate Find the standard error of estimate Se and interpret the results."

검증된 단계별 안내
1
Step 1: Understand the problem. The goal is to calculate the standard error of estimate (Se), which measures the accuracy of predictions made by a regression line. The data provided includes the years (x) and the average age of vehicles (y).
Step 2: Write down the formula for the standard error of estimate: Se = sqrt((Σ(y - ŷ)2) / (n - 2)), where y represents the observed values, ŷ represents the predicted values from the regression line, and n is the number of data points.
Step 3: Perform a linear regression analysis to find the regression equation. Use the given data points to calculate the slope (b) and y-intercept (a) of the regression line using the formulas: b = Σ((x - x̄)(y - ȳ)) / Σ((x - x̄)2) and a = ȳ - b * x̄, where x̄ and ȳ are the means of x and y, respectively.
Step 4: Use the regression equation (ŷ = a + b * x) to calculate the predicted values (ŷ) for each year in the dataset. Then, compute the squared differences between the observed values (y) and the predicted values (ŷ), i.e., (y - ŷ)2.
Step 5: Sum up all the squared differences, divide by (n - 2), and take the square root to find Se. Interpret the result: A smaller Se indicates that the regression line predicts the data more accurately, while a larger Se suggests greater variability in the predictions.

비슷한 문제에 대한 검증된 영상 답변:

이 영상 해법은 위 문제에 도움이 된다고 튜터들이 추천한 것입니다.
영상 길이:
3m
도움이 되었나요?

주요 개념

질문에 올바르게 답하기 위해 반드시 이해해야 하는 핵심 개념들은 다음과 같습니다.

Standard Error of Estimate (Se)

The Standard Error of Estimate (Se) measures the accuracy of predictions made by a regression model. It quantifies the average distance that the observed values fall from the regression line. A smaller Se indicates a better fit of the model to the data, meaning predictions are closer to actual values, while a larger Se suggests more variability and less reliability in predictions.
추천 영상:
가이드 코스
08:45
Calculating Standard Deviation

Regression Analysis

Regression analysis is a statistical method used to examine the relationship between two or more variables. In this context, it helps to understand how the average age of vehicles (dependent variable) changes over the years (independent variable). By fitting a regression line to the data, we can make predictions and assess trends in vehicle age over time.
추천 영상:
가이드 코스
07:01
Intro to Least Squares Regression

Interpretation of Results

Interpreting results in statistics involves understanding what the calculated values mean in the context of the data. For the standard error of estimate, this means assessing how well the regression model predicts the average age of vehicles. A clear interpretation helps in making informed decisions based on the statistical analysis, such as identifying trends in vehicle longevity.
추천 영상:
가이드 코스
07:10
Empirical Rule of Standard Deviation and Range Rule of Thumb