


Ch. 1 - Introduction to Statistics
Triola - Elementary Statistics 14th Edition
Triola14th EditionElementary StatisticsISBN: 9780137366446당신이 사용하는 게 아니라요?교과서 변경
1장, 문제 1.1.21

In Exercises 21–24, refer to the sample of body temperatures (degrees Fahrenheit) in the table below. (The body temperatures are from Data Set 5 in Appendix B.)
[IMAGE]
Context of the Data Refer to the table of body temperatures. Is there some meaningful way in which each body temperature recorded at 8 AM is matched with the 12 AM temperature?

검증된 단계별 안내
1
Identify the variables: In this problem, the variables are the body temperatures recorded at two different times, 8 AM and 12 AM.
Understand the concept of paired data: Paired data occurs when two sets of observations are linked in some meaningful way. Here, each 8 AM temperature is paired with the corresponding 12 AM temperature for the same individual.
Consider the context: Determine if there is a logical reason to pair the temperatures. For example, if the temperatures are from the same individual, it makes sense to pair them to analyze changes over time.
Explore statistical methods for paired data: If the data is paired, you might use methods like the paired t-test to compare the means of the two sets of temperatures.
Reflect on the implications: Consider what the results of such an analysis might tell you about the relationship between body temperatures at different times of the day.

비슷한 문제에 대한 검증된 영상 답변:

이 영상 해법은 위 문제에 도움이 된다고 튜터들이 추천한 것입니다.
영상 길이:
2m
도움이 되었나요?

주요 개념

질문에 올바르게 답하기 위해 반드시 이해해야 하는 핵심 개념들은 다음과 같습니다.

Paired Data

Paired data involves two sets of related observations, where each observation in one set is matched with an observation in the other set. In this context, body temperatures recorded at 8 AM and 12 AM for the same individual can be considered paired data, allowing for comparisons or analyses of changes over time within the same subject.
추천 영상:
가이드 코스
08:33
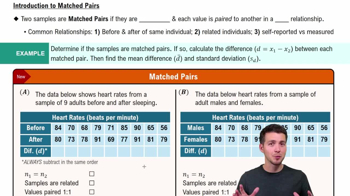
Introduction to Matched Pairs

Correlation

Correlation measures the strength and direction of a linear relationship between two variables. Understanding correlation is essential when analyzing paired data, as it helps determine if there is a consistent pattern or relationship between body temperatures recorded at different times, such as 8 AM and 12 AM.
추천 영상:
가이드 코스
05:43
Correlation Coefficient

Statistical Significance

Statistical significance assesses whether the observed relationship or difference in data is likely due to chance or represents a true effect. When comparing body temperatures at 8 AM and 12 AM, determining statistical significance can help conclude if the differences are meaningful or if they occurred randomly.
추천 영상:
가이드 코스
05:53
Parameters vs. Statistics