

Ch. 1 - Introduction to Statistics
Triola - Elementary Statistics 14th Edition
Triola14th EditionElementary StatisticsISBN: 9780137366446당신이 사용하는 게 아니라요?교과서 변경
1장, 문제 1.CQQ.2

Survey Which of the following best describes the level of measurement of the numbers 1, 2, 3, . . . , 410 described in Exercise 1: nominal, ordinal, interval, ratio?

검증된 단계별 안내
1
Understand the four levels of measurement: nominal, ordinal, interval, and ratio. Nominal involves categories without a specific order, ordinal involves categories with a specific order, interval involves ordered categories with equal intervals but no true zero, and ratio involves ordered categories with equal intervals and a true zero.
Identify the context in which the numbers 1, 2, 3, ..., 410 are used. This context will help determine the level of measurement.
Consider if the numbers represent categories without order (nominal) or with order (ordinal). If they represent a ranking or position, they might be ordinal.
Determine if the numbers have meaningful intervals between them (interval level) or if they have a true zero point, which would indicate a ratio level of measurement.
Conclude the level of measurement by matching the characteristics of the numbers to the definitions of nominal, ordinal, interval, or ratio. For example, if the numbers represent a count with a true zero, they are at the ratio level.

비슷한 문제에 대한 검증된 영상 답변:

이 영상 해법은 위 문제에 도움이 된다고 튜터들이 추천한 것입니다.
영상 길이:
2m

주요 개념

질문에 올바르게 답하기 위해 반드시 이해해야 하는 핵심 개념들은 다음과 같습니다.

Levels of Measurement

Levels of measurement refer to the nature of data and dictate the types of statistical analyses that can be performed. The four levels are nominal, ordinal, interval, and ratio. Nominal data categorize without a specific order, ordinal data have a defined order, interval data have equal intervals without a true zero, and ratio data have equal intervals with a true zero.
추천 영상:
가이드 코스
10:28
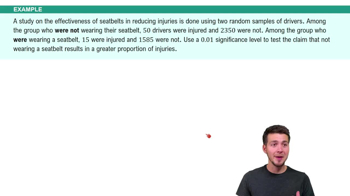
Difference in Proportions: Hypothesis Tests Example 1

Ordinal Level

The ordinal level of measurement involves data that can be ordered or ranked, but the differences between data points are not meaningful. For example, survey responses like 'satisfied,' 'neutral,' and 'dissatisfied' can be ranked, but the difference between them is not quantifiable. This level is crucial for understanding data that imply a sequence or order.
추천 영상:
가이드 코스
04:46
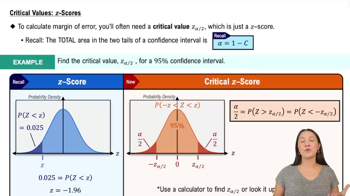
Critical Values: z Scores

Interval and Ratio Levels

Interval and ratio levels of measurement both involve numerical data with meaningful differences between values. Interval data lack a true zero point, such as temperature in Celsius, while ratio data have a true zero, allowing for meaningful ratios, such as weight or height. Understanding these distinctions helps in selecting appropriate statistical methods for analysis.
추천 영상:
가이드 코스
06:33
Introduction to Confidence Intervals
관련 실천
교과서 질문

In Exercises 9–12, the given expressions are designed to yield results expressed in a form of scientific notation. For example, the calculator-displayed result of 1.23E5 can be expressed as 123,000, and the result of 1.23E-4 can be expressed as 0.000123. Perform the indicated operation and express the result as an ordinary number that is not in scientific notation.


(0.2)^12

282
views
교과서 질문

Physicians’ Health Study In the Physicians’ Health Study, some of the subjects were treated with aspirin while others were given a placebo. For the subjects in this experiment, what is blinding?

272
views
교과서 질문

In Exercises 9–12, the given expressions are designed to yield results expressed in a form of scientific notation. For example, the calculator-displayed result of 1.23E5 can be expressed as 123,000, and the result of 1.23E-4 can be expressed as 0.000123. Perform the indicated operation and express the result as an ordinary number that is not in scientific notation.


(8)^12

252
views
교과서 질문

Birth Weights For 100 randomly selected births from Bellevue Hospital Center, the birth weights are added and then divided by 100. The result is 3240 g. Is the value of 3240 g a statistic or a parameter?

294
views
교과서 질문

Types of Data In each of the following, identify the level of measurement of the sample data (nominal, ordinal, interval, ratio) and the type of sampling used to obtain the data (random, systematic, convenience, stratified, cluster).


b. In each of the 50 states, 50 voters are randomly selected and their political party affiliations are identified.

280
views
교과서 질문

Birth Weights Refer to the sample described in Exercise 6. Because Bellevue Hospital Center agreed to provide the 100 birth weights, does the sample of birth weights constitute a voluntary response sample?

253
views