Ch. 12 - Analysis of Variance
Triola - Elementary Statistics 14th Edition
Triola14th EditionElementary StatisticsISBN: 9780137366446당신이 사용하는 게 아니라요?교과서 변경
12장, 문제 12.1.18a

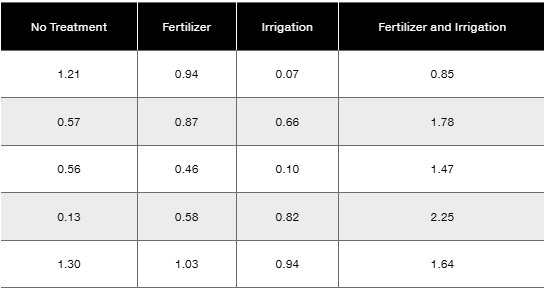
Bonferroni Test Shown below are weights (kg) of poplar trees obtained from trees planted in a rich and moist region. The trees were given different treatments identified in the table below. The data are from a study conducted by researchers at Pennsylvania State University and were provided by Minitab, Inc. Also shown are partial results from using the Bonferroni test with the sample data.
a. Use a 0.05 significance level to test the claim that the different treatments result in the same mean weight.

검증된 단계별 안내
1
Step 1: Identify the null and alternative hypotheses for the test. The null hypothesis (H0) is that all treatment means are equal, i.e., \( \mu_1 = \mu_2 = \mu_3 = \mu_4 \). The alternative hypothesis (Ha) is that at least one treatment mean is different.
Step 2: Perform an ANOVA test to determine if there is a statistically significant difference among the treatment means. This involves calculating the between-group variability and within-group variability and then computing the F-statistic.
Step 3: Use the significance level \( \alpha = 0.05 \) to compare the p-value from the ANOVA test. If the p-value is less than 0.05, reject the null hypothesis, indicating that not all treatment means are equal.
Step 4: Since the ANOVA test indicates a difference, use the Bonferroni test to perform pairwise comparisons between treatment means. The Bonferroni test adjusts the significance level to control for Type I error when making multiple comparisons.
Step 5: For each pairwise comparison, calculate the confidence intervals or p-values using the Bonferroni correction. If any confidence interval does not include zero or any p-value is less than the adjusted significance level, conclude that those treatment means differ significantly.

비슷한 문제에 대한 검증된 영상 답변:

이 영상 해법은 위 문제에 도움이 된다고 튜터들이 추천한 것입니다.
영상 길이:
3m
도움이 되었나요?

주요 개념

질문에 올바르게 답하기 위해 반드시 이해해야 하는 핵심 개념들은 다음과 같습니다.

Analysis of Variance (ANOVA)

ANOVA is a statistical method used to compare the means of three or more groups to determine if at least one group mean is significantly different. It tests the null hypothesis that all group means are equal by analyzing variance within and between groups. A significant ANOVA result suggests differences among treatments.
추천 영상:
가이드 코스
06:46
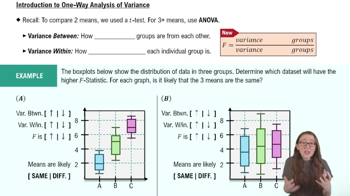
Introduction to ANOVA

Bonferroni Test

The Bonferroni test is a post-hoc multiple comparison procedure used after ANOVA to identify which specific group means differ. It adjusts the significance level to control the overall Type I error rate when making multiple pairwise comparisons, ensuring more reliable conclusions about treatment effects.
추천 영상:
가이드 코스
06:28
Independence Test

Significance Level and Hypothesis Testing

The significance level (commonly 0.05) is the threshold for deciding whether to reject the null hypothesis. It represents the probability of making a Type I error, or falsely detecting an effect. In this context, it helps determine if the treatments have statistically different mean weights.
추천 영상:
가이드 코스
05:52
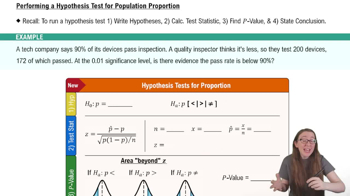
Performing Hypothesis Tests: Proportions
관련 실천
교과서 질문

Interaction


a. What is an interaction between two factors?


503
views

교과서 질문

Transformations of Data Example 1 illustrated the use of two-way ANOVA to analyze the sample data in Table 12-3. How are the results affected in each of the following cases?


a. The same constant is added to each sample value.

192
views
교과서 질문

Birth Weights The table below lists some of the same data used in the preceding exercise, but the seven days of the week are combined into weekday (Monday, Tuesday, Wednesday, Thursday, Friday) and weekend days (Saturday, Sunday). Also, the birth weights are converted to kilograms. What do you conclude?

128
views
교과서 질문

Bonferroni Test Shown below are weights (kg) of poplar trees obtained from trees planted in a rich and moist region. The trees were given different treatments identified in the table below. The data are from a study conducted by researchers at Pennsylvania State University and were provided by Minitab, Inc. Also shown are partial results from using the Bonferroni test with the sample data.

b. What do the displayed Bonferroni SPSS results tell us?

43
views
교과서 질문

In Exercises 1–4, use the following listed measured amounts of chest compression (mm) from car crash tests (from Data Set 35 “Car Data” in Appendix B). Also shown are the SPSS results from analysis of variance. Assume that we plan to use a 0.05 significance level to test the claim that the different car sizes have the same mean amount of chest compression.


Anova


a. What characteristic of the data above indicates that we should use one-way analysis of variance?

120
views
교과서 질문

Birth Weights Data Set 6 “Births” includes birth weights (g), hospitals, and the day of the week that mothers were admitted to the hospital. Using rows to represent the four hospitals (Albany Medical Center, Bellevue Hospital Center, Olean General Hospital, Strong Memorial Hospital), and using columns to represent the seven different days of the week, a two-way table has 28 individual cells. Using five birth weights for each of those 28 cells and using StatCrunch for two-way analysis of variance, we get the results displayed below. What do you conclude?

44
views