


Ch. 12 - Analysis of Variance
Triola - Elementary Statistics 14th Edition
Triola14th EditionElementary StatisticsISBN: 9780137366446당신이 사용하는 게 아니라요?교과서 변경
12장, 문제 12.2.3c

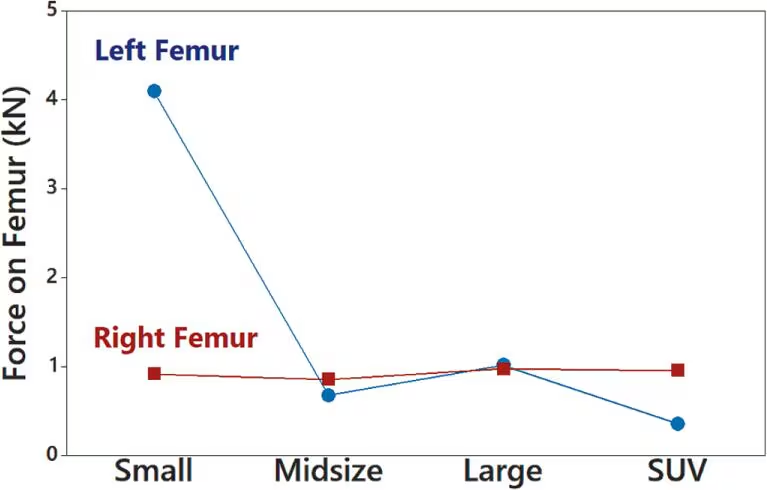
c. Shown below is an interaction graph constructed from the data in Exercise 1. What does the graph suggest?
Interaction graph showing force on left and right femur across vehicle sizes: Small, Midsize, Large, SUV.

검증된 단계별 안내
1
Step 1: Observe the graph and identify the variables. The graph shows the force on the femur (in kN) for two categories: Left Femur (blue circles) and Right Femur (red squares), across four vehicle types: Small, Midsize, Large, and SUV.
Step 2: Analyze the trend for the Left Femur. The force on the Left Femur starts high for Small vehicles, decreases significantly for Midsize vehicles, remains low for Large vehicles, and decreases further for SUVs.
Step 3: Analyze the trend for the Right Femur. The force on the Right Femur remains relatively constant across all vehicle types, with values close to 1 kN.
Step 4: Compare the interaction between Left Femur and Right Femur forces. The graph suggests that the force on the Left Femur is highly variable across vehicle types, while the force on the Right Femur is stable. This indicates an interaction effect where the type of vehicle influences the force on the Left Femur more significantly than on the Right Femur.
Step 5: Interpret the overall suggestion of the graph. The interaction graph implies that vehicle type has a differential impact on the forces experienced by the Left and Right Femurs, with the Left Femur being more sensitive to changes in vehicle type.

비슷한 문제에 대한 검증된 영상 답변:

이 영상 해법은 위 문제에 도움이 된다고 튜터들이 추천한 것입니다.
영상 길이:
4m
도움이 되었나요?

주요 개념

질문에 올바르게 답하기 위해 반드시 이해해야 하는 핵심 개념들은 다음과 같습니다.

Interaction Graphs

Interaction graphs visually represent the relationship between two or more variables, showing how one variable affects another across different conditions. In this case, the graph illustrates the force exerted on the left and right femur across various vehicle sizes, highlighting differences in impact based on the type of vehicle.
추천 영상:
04:13
Creating Time-Series Graphs

Force Measurement

Force is a vector quantity that causes an object to undergo a change in motion, measured in kilonewtons (kN) in this context. Understanding how force is distributed across the left and right femur helps in analyzing the safety and impact of different vehicle sizes on human anatomy during collisions.
추천 영상:
가이드 코스
04:39
Visualizing Qualitative vs. Quantitative Data

Comparative Analysis

Comparative analysis involves evaluating the differences and similarities between two or more groups or conditions. In this graph, comparing the forces on the left and right femur across different vehicle sizes allows for insights into how vehicle design may influence injury risk in accidents.
추천 영상:
가이드 코스
04:48
Comparing Mean vs. Median
관련 실천
교과서 질문

Bonferroni Test Shown below are weights (kg) of poplar trees obtained from trees planted in a rich and moist region. The trees were given different treatments identified in the table below. The data are from a study conducted by researchers at Pennsylvania State University and were provided by Minitab, Inc. Also shown are partial results from using the Bonferroni test with the sample data.

c. Use the Bonferroni test procedure with a 0.05 significance level to test for a significant difference between the mean amount of the irrigation treatment group and the group treated with both fertilizer and irrigation. Identify the test statistic and either the P-value or critical values. What do the results indicate?

33
views
교과서 질문

Transformations of Data Example 1 illustrated the use of two-way ANOVA to analyze the sample data in Table 12-3. How are the results affected in each of the following cases?


b. Each sample value is multiplied by the same nonzero constant.

158
views
교과서 질문

In Exercises 1–5, refer to the following list of numbers of years that deceased U.S. presidents, popes, and British monarchs lived after their inauguration, election, or coronation, respectively. (As of this writing, the last president is George H. W. Bush, the last pope is John Paul II, and the last British monarch is George VI.) Assume that the data are samples from larger populations.


[Image]


Exploring the Data Include appropriate units in all answers.


d. Are there any obvious outliers?

132
views
교과서 질문

Transformations of Data Example 1 illustrated the use of two-way ANOVA to analyze the sample data in Table 12-3. How are the results affected in each of the following cases?


c. The format of the table is transposed so that the row and column factors are interchanged.


115
views
교과서 질문

Transformations of Data Example 1 illustrated the use of two-way ANOVA to analyze the sample data in Table 12-3. How are the results affected in each of the following cases?


d. The first sample value in the first cell is changed so that it becomes an outlier.

115
views