



Ch. 12 - Analysis of Variance
Triola - Elementary Statistics 14th Edition
Triola14th EditionElementary StatisticsISBN: 9780137366446당신이 사용하는 게 아니라요?교과서 변경
12장, 문제 12.CQ.2

Cola Weights For the four samples described in Exercise 1, the sample of regular Coke has a mean weight of 0.81682 lb, the sample of Diet Coke has a mean weight of 0.78479 lb, the sample of regular Pepsi has a mean weight of 0.82410 lb, and the sample of Diet Pepsi has a mean weight of 0.78386 lb. If we use analysis of variance and reach a conclusion to reject equality of the four sample means, can we then conclude that any of the specific samples have means that are significantly different from the others?
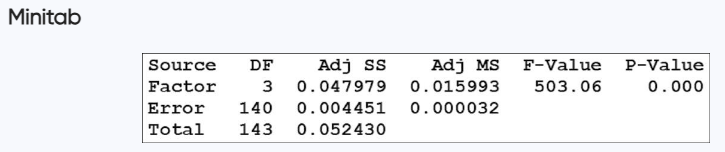
ANOVA table showing significant difference in cola weights with F-value 503.06 and P-value 0.000.

검증된 단계별 안내
1
Step 1: Understand the context of the problem. The question asks whether rejecting the equality of the four sample means using analysis of variance (ANOVA) implies that specific sample means are significantly different from each other. ANOVA tests whether there is a significant difference among group means, but it does not specify which groups differ.
Step 2: Review the ANOVA table provided. The table shows the F-value (503.06) and the P-value (0.000). A P-value of 0.000 indicates that the null hypothesis (all means are equal) is rejected at any reasonable significance level. This means there is evidence of at least one mean being different.
Step 3: Recognize the limitation of ANOVA. While ANOVA indicates that at least one mean is different, it does not identify which specific means differ. To determine this, post-hoc tests such as Tukey's HSD, Bonferroni, or Scheffé tests are required.
Step 4: Explain the next steps. To identify which specific sample means differ, conduct a post-hoc test. These tests compare each pair of means to determine if the difference is statistically significant while controlling for Type I error.
Step 5: Conclude the interpretation. Rejecting the null hypothesis in ANOVA suggests that there is a difference among the group means, but further analysis (post-hoc tests) is necessary to pinpoint the specific groups with significant differences.

비슷한 문제에 대한 검증된 영상 답변:

이 영상 해법은 위 문제에 도움이 된다고 튜터들이 추천한 것입니다.
영상 길이:
1m
도움이 되었나요?

주요 개념

질문에 올바르게 답하기 위해 반드시 이해해야 하는 핵심 개념들은 다음과 같습니다.

Analysis of Variance (ANOVA)

ANOVA is a statistical method used to compare the means of three or more groups to determine if at least one group mean is significantly different from the others. It assesses the impact of one or more factors by comparing the variance within groups to the variance between groups. A significant F-value indicates that the group means are not all equal, prompting further investigation into which specific means differ.
추천 영상:
가이드 코스
04:48
Variance & Standard Deviation of Discrete Random Variables

F-value

The F-value is a ratio used in ANOVA that compares the variance between the group means to the variance within the groups. A higher F-value suggests a greater disparity between the group means relative to the variability within the groups. In the provided ANOVA table, an F-value of 503.06 indicates a strong likelihood that at least one group mean is significantly different from the others.
추천 영상:
05:50
Critical Values: t-Distribution

P-value

The P-value in hypothesis testing indicates the probability of observing the data, or something more extreme, assuming the null hypothesis is true. A P-value of 0.000, as shown in the ANOVA table, suggests that the observed differences in means are statistically significant, leading to the rejection of the null hypothesis that all group means are equal. This implies that at least one sample mean is significantly different from the others.
추천 영상:
가이드 코스
06:50
Step 3: Get P-Value
관련 실천
교과서 질문

In Exercises 5–16, use analysis of variance for the indicated test.


Clancy, Rowling, and Tolstoy Ease of Reading Pages were randomly selected from three books: The Bear and the Dragon by Tom Clancy, Harry Potter and the Sorcerer’s Stone by J.K. Rowling, and War and Peace by Leo Tolstoy. Listed below are Flesch Reading Ease Scores for those pages. Use a 0.05 significance level to test the claim that pages from books by those three authors have the same mean Flesch Reading Ease score. Given that higher scores correspond to text that is easier to read, which author appears to be different, and how is that author different?


131
views
교과서 질문

Cola Weights The displayed results from Exercise 1 are from one-way analysis of variance. What is it about this test that characterizes it as one-way analysis of variance instead of two-way analysis of variance?

109
views
교과서 질문

Quarters Assume that weights of quarters minted after 1964 are normally distributed with a mean of 5.670 g and a standard deviation of 0.062 g (based on U.S. Mint specifications).

b. If 25 quarters are randomly selected, find the probability that their mean weight is greater than 5.675 g.

104
views
교과서 질문

Normal Quantile Plot The accompanying normal quantile plot was obtained from the longevity times of presidents. What does this graph tell us?

154
views
교과서 질문

Car Crash Test Measurements If we use the data given in Exercise 1 with two-way analysis of variance and a 0.05 significance level, we get the accompanying display. What do you conclude?

104
views
교과서 질문

Cola Weights Data Set 37 “Cola Weights and Volumes” in Appendix B lists the weights (lb) of the contents of cans of cola from four different samples: (1) regular Coke, (2) Diet Coke, (3) regular Pepsi, and (4) Diet Pepsi. The results from analysis of variance are shown in the Minitab display below. What is the null hypothesis for this analysis of variance test? Based on the displayed results, what should you conclude about H_knot. What do you conclude about equality of the mean weights from the four samples?

161
views