Ch. 12 - Analysis of Variance
Triola - Elementary Statistics 14th Edition
Triola14th EditionElementary StatisticsISBN: 9780137366446당신이 사용하는 게 아니라요?교과서 변경
12장, 문제 12.CR.3

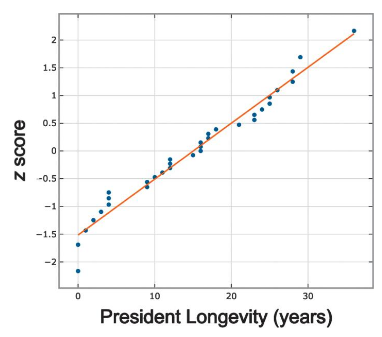
Normal Quantile Plot The accompanying normal quantile plot was obtained from the longevity times of presidents. What does this graph tell us?
Normal quantile plot showing president longevity times with points closely following a diagonal line, indicating normal distribution.

검증된 단계별 안내
1
Step 1: Understand the purpose of a normal quantile plot. A normal quantile plot is used to assess whether a dataset follows a normal distribution. If the points in the plot closely follow a straight line, it suggests that the data is approximately normally distributed.
Step 2: Analyze the axes of the plot. The x-axis represents the longevity times of presidents (in years), and the y-axis represents the corresponding z-scores, which are standardized values indicating how far each data point is from the mean in terms of standard deviations.
Step 3: Observe the pattern of the points. In this plot, the points closely follow a straight line, which indicates that the longevity times of presidents are approximately normally distributed.
Step 4: Interpret deviations from the line. If there were significant deviations from the straight line, it would suggest skewness or other departures from normality. However, in this case, the points align well with the line, supporting the normality assumption.
Step 5: Conclude the analysis. Based on the normal quantile plot, we can conclude that the longevity times of presidents appear to follow a normal distribution, which is useful for further statistical analysis that assumes normality.

비슷한 문제에 대한 검증된 영상 답변:

이 영상 해법은 위 문제에 도움이 된다고 튜터들이 추천한 것입니다.
영상 길이:
1m
도움이 되었나요?

주요 개념

질문에 올바르게 답하기 위해 반드시 이해해야 하는 핵심 개념들은 다음과 같습니다.

Normal Distribution

Normal distribution is a probability distribution that is symmetric about the mean, showing that data near the mean are more frequent in occurrence than data far from the mean. In a normal distribution, about 68% of the data falls within one standard deviation of the mean, and about 95% falls within two standard deviations. This concept is crucial for understanding how data is expected to behave in many natural phenomena.
추천 영상:
가이드 코스
09:47
Finding Standard Normal Probabilities using z-Table

Quantile Plot

A quantile plot, specifically a normal quantile plot, is a graphical tool used to assess if a dataset follows a normal distribution. It plots the quantiles of the data against the quantiles of a normal distribution. If the points on the plot closely follow a straight line, it indicates that the data is normally distributed, while deviations from the line suggest departures from normality.
추천 영상:
04:01
Creating Dotplots

Z-Score

A Z-score is a statistical measurement that describes a value's relationship to the mean of a group of values. It is calculated by subtracting the mean from the value and then dividing by the standard deviation. Z-scores are useful for understanding how far away a particular data point is from the mean, allowing for comparisons across different datasets and identifying outliers.
추천 영상:
가이드 코스
06:31
Z-Scores From Given Probability - TI-84 (CE) Calculator
관련 실천
교과서 질문

Cola Weights The displayed results from Exercise 1 are from one-way analysis of variance. What is it about this test that characterizes it as one-way analysis of variance instead of two-way analysis of variance?

109
views

교과서 질문

Quarters Assume that weights of quarters minted after 1964 are normally distributed with a mean of 5.670 g and a standard deviation of 0.062 g (based on U.S. Mint specifications).

b. If 25 quarters are randomly selected, find the probability that their mean weight is greater than 5.675 g.

104
views
교과서 질문

Win 4 Lottery Shown below is a histogram of digits selected in California’s Win 4 lottery. Each drawing involves the random selection (with replacement) of four digits between 0 and 9 inclusive.


c. Identify the frequencies, then test the claim that the digits are selected from a population in which the digits are all equally likely. Is there a problem with the lottery?


140
views
교과서 질문

Cola Weights For the four samples described in Exercise 1, the sample of regular Coke has a mean weight of 0.81682 lb, the sample of Diet Coke has a mean weight of 0.78479 lb, the sample of regular Pepsi has a mean weight of 0.82410 lb, and the sample of Diet Pepsi has a mean weight of 0.78386 lb. If we use analysis of variance and reach a conclusion to reject equality of the four sample means, can we then conclude that any of the specific samples have means that are significantly different from the others?

100
views
교과서 질문

Cola Weights Data Set 37 “Cola Weights and Volumes” in Appendix B lists the weights (lb) of the contents of cans of cola from four different samples: (1) regular Coke, (2) Diet Coke, (3) regular Pepsi, and (4) Diet Pepsi. The results from analysis of variance are shown in the Minitab display below. What is the null hypothesis for this analysis of variance test? Based on the displayed results, what should you conclude about H_knot. What do you conclude about equality of the mean weights from the four samples?

161
views
교과서 질문

Win 4 Lottery Shown below is a histogram of digits selected in California’s Win 4 lottery. Each drawing involves the random selection (with replacement) of four digits between 0 and 9 inclusive.


b. Does the display depict a normal distribution? Why or why not? What should be the shape of the histogram?


141
views