

Births Natural births randomly selected from four hospitals in New York State occurred on the days of the week (in the order of Monday through Sunday) with these frequencies: 52, 66, 72, 57, 57, 43, 53. Does it appear that such births occur on the days of the week with equal frequency?
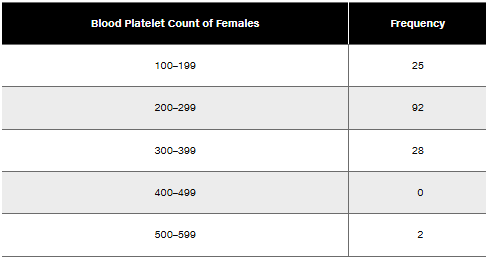
In Exercises 5–8, identify the class width, class midpoints, and class boundaries for the given frequency distribution. Also identify the number of individuals included in the summary. The frequency distributions are based on real data from Appendix B.
8. 
검증된 단계별 안내
비슷한 문제에 대한 검증된 영상 답변:
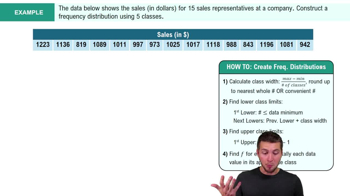
주요 개념
Class Width
Class Midpoint
Class Boundaries
In Exercises 9–18, construct the histograms and answer the given questions.
Chicago Commute Time Use the frequency distribution from Exercise 13 in Section 2-1 to construct a histogram. Does it appear to be the graph of data from a population with a normal distribution?
In Exercises 5–8, answer the questions by referring to the following Minitab-generated histogram, which depicts the weights (grams) of all quarters listed in Data Set 40 “Coin Weights” in Appendix B. (Grams are actually units of mass and the values shown on the horizontal scale are rounded.)
Sample Size What is the approximate number of quarters depicted in the three bars farthest to the left?
Boston Commute Time The accompanying table summarizes daily commute times in Boston. How many commute times are included in the summary? Is it possible to identify the exact values of all of the original data amounts?
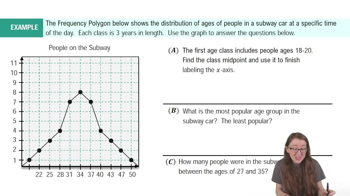
In Exercises 15 and 16, construct the frequency polygons.
Chicago Commute Times Use the frequency distribution from Exercise 13 in Section 2-1 to construct a frequency polygon. Does the graph suggest that the distribution is skewed? If so, how?
In Exercises 9–18, construct the histograms and answer the given questions.
Old Faithful Use the frequency distribution from Exercise 15 in Section 2-1 to construct a histogram. Does it appear to be the graph of data from a population with a normal distribution?
