Ch. 2 - Exploring Data with Tables and Graphs
Triola - Elementary Statistics 14th Edition
Triola14th EditionElementary StatisticsISBN: 9780137366446당신이 사용하는 게 아니라요?교과서 변경
2장, 문제 2.q.1

Tornado Alley Refer to the accompanying frequency distribution that summarizes the number of tornadoes in Oklahoma in each year for the past several years. What is the class width? Is it possible to identify the original data values?
Table displaying the frequency distribution of annual tornadoes in Oklahoma over several years.

검증된 단계별 안내
1
Step 1: To determine the class width, observe the intervals in the 'Annual Tornadoes in Oklahoma' column. The class width is calculated as the difference between the lower boundary of one class and the lower boundary of the next class. For example, subtract 0 (lower boundary of the first class) from 20 (lower boundary of the second class).
Step 2: Perform the subtraction: 20 - 0 = 20. This indicates that the class width is 20. Repeat this calculation for other intervals to confirm consistency.
Step 3: To address whether it is possible to identify the original data values, consider the nature of the frequency distribution. Frequency distributions group data into intervals, so the exact original data values within each interval are not preserved. For example, in the interval 0–19, we only know there are 3 years with tornado counts in this range, but we do not know the specific counts for those years.
Step 4: Understand that frequency distributions are designed to summarize data, not to retain individual data points. Therefore, it is not possible to identify the original data values from the given frequency distribution.
Step 5: Conclude that the class width is 20, and the original data values cannot be identified from the frequency distribution because the data has been grouped into intervals.

비슷한 문제에 대한 검증된 영상 답변:

이 영상 해법은 위 문제에 도움이 된다고 튜터들이 추천한 것입니다.
영상 길이:
2m
도움이 되었나요?

주요 개념

질문에 올바르게 답하기 위해 반드시 이해해야 하는 핵심 개념들은 다음과 같습니다.

Class Width

Class width refers to the range of values that each class interval in a frequency distribution covers. It is calculated by subtracting the lower limit of a class from its upper limit. In the provided frequency distribution, the class width can be determined by examining the intervals, such as 0-19, 20-39, etc., which all have a consistent width of 20.
추천 영상:
가이드 코스
05:18
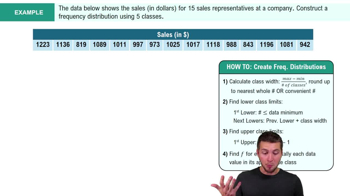
How to Create Frequency Distributions Example 2

Frequency Distribution

A frequency distribution is a summary of how often each value or range of values occurs in a dataset. It organizes data into classes or intervals, showing the number of occurrences (frequency) for each class. This helps in visualizing the distribution of data points, such as the number of tornadoes in Oklahoma over the years, allowing for easier analysis of trends and patterns.
추천 영상:
가이드 코스
06:38
Intro to Frequency Distributions

Original Data Values

Original data values refer to the individual data points that were used to create the frequency distribution. While the frequency distribution provides a summary, it does not reveal the specific values within each class interval. Therefore, it is not possible to identify the exact original data values from the frequency distribution alone, as it aggregates data into broader categories.
추천 영상:
가이드 코스
04:39
Visualizing Qualitative vs. Quantitative Data