


Ch. 2 - Exploring Data with Tables and Graphs
Triola - Elementary Statistics 14th Edition
Triola14th EditionElementary StatisticsISBN: 9780137366446당신이 사용하는 게 아니라요?교과서 변경
2장, 문제 2.2.19d

Interpreting Normal Quantile Plots Which of the following normal quantile plots appear to represent data from a population having a normal distribution? Explain.
Scatter plot with data points and a green line showing a normal quantile plot with X values and Z scores.

검증된 단계별 안내
1
Step 1: Understand the purpose of a normal quantile plot. A normal quantile plot is used to assess whether a dataset follows a normal distribution. If the data is normally distributed, the points in the plot will approximately form a straight line.
Step 2: Observe the plot provided. The x-axis represents the data values (X Values), and the y-axis represents the corresponding z-scores (standardized values). The green line represents the expected linear relationship if the data is normally distributed.
Step 3: Analyze the alignment of the data points with the green line. If the points closely follow the green line with minimal deviation, this suggests the data is likely from a population with a normal distribution. Significant deviations or curvature would indicate non-normality.
Step 4: Note any patterns or deviations. In the provided plot, the points generally follow the green line, but there are slight deviations at the lower and upper ends. These deviations could indicate minor departures from normality, but overall, the data appears reasonably linear.
Step 5: Conclude based on the analysis. Since the majority of the points align well with the green line, the plot suggests that the data is likely from a population having a normal distribution, with minor deviations that may not significantly affect the overall normality.

비슷한 문제에 대한 검증된 영상 답변:

이 영상 해법은 위 문제에 도움이 된다고 튜터들이 추천한 것입니다.
영상 길이:
1m
도움이 되었나요?

주요 개념

질문에 올바르게 답하기 위해 반드시 이해해야 하는 핵심 개념들은 다음과 같습니다.

Normal Distribution

A normal distribution is a continuous probability distribution characterized by its bell-shaped curve, where most of the observations cluster around the central peak and probabilities for values further away from the mean taper off symmetrically. It is defined by two parameters: the mean (average) and the standard deviation (spread). Understanding this concept is crucial for interpreting data that is expected to follow this pattern.
추천 영상:
가이드 코스
03:17
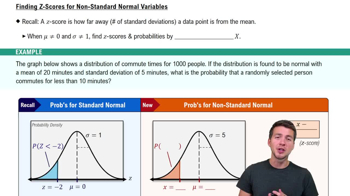
Finding Z-Scores for Non-Standard Normal Variables

Quantile Plot

A quantile plot, specifically a normal quantile plot, is a graphical tool used to assess if a dataset follows a normal distribution. It plots the quantiles of the data against the quantiles of a normal distribution. If the points in the plot closely follow a straight line, it suggests that the data is normally distributed, while deviations from this line indicate departures from normality.
추천 영상:
가이드 코스
07:38
Residuals and Residual Plots

Z-scores

A Z-score represents the number of standard deviations a data point is from the mean of the dataset. It is calculated by subtracting the mean from the data point and dividing by the standard deviation. In the context of a normal quantile plot, Z-scores are used to standardize the data, allowing for a direct comparison to the expected values of a normal distribution, which aids in identifying normality.
추천 영상:
가이드 코스
06:31
Z-Scores From Given Probability - TI-84 (CE) Calculator
관련 실천
교과서 질문

In Exercises 1–5, use the data listed in the margin, which are magnitudes (Richter scale) and depths (km) of earthquakes from Data Set 24 “Earthquakes” in Appendix B

Frequency Distribution Construct a frequency distribution of the magnitudes. Use a class width of 0.50 and use a starting value of 1.00.

107
views
교과서 질문

Tornado Alley Refer to the accompanying frequency distribution that summarizes the number of tornadoes in Oklahoma in each year for the past several years. What is the class width? Is it possible to identify the original data values?

134
views
교과서 질문

In Exercises 1–5, use the data listed in the margin, which are magnitudes (Richter scale) and depths (km) of earthquakes from Data Set 24 “Earthquakes” in Appendix B


Histogram Construct the histogram corresponding to the frequency distribution from Exercise 1. For the values on the horizontal axis, use the class midpoint values. Which of the following comes closest to describing the distribution: uniform, normal, skewed left, skewed right?


113
views
교과서 질문

Estimating r For each of the following, estimate the value of the linear correlation coefficient r for the given paired data obtained from 50 randomly selected adults.


d. The 50 adults all drove cars from Jacksonville, Florida, to Richmond, Virginia. Their average (mean) speeds are recorded along with the times it took to complete that trip.

147
views
교과서 질문

Tornado Alley Using the same frequency distribution from Exercise 1, identify the class limits of the first class and the class boundaries of the first class.

142
views
교과서 질문

Tornado Alley Construct the relative frequency distribution corresponding to the frequency distribution in Exercise 1

146
views