Ch. 4 - Probability
Triola - Elementary Statistics 14th Edition
Triola14th EditionElementary StatisticsISBN: 9780137366446당신이 사용하는 게 아니라요?교과서 변경
4장, 문제 4.2.7

Laundry Symbols Based on a New Generation of Stains survey, 13% of U.S. adults know that the care-instruction symbol on clothing means that any bleach can be used. Find the probability of randomly selecting an adult in the U.S. who does not know that.

검증된 단계별 안내
1
Step 1: Understand the problem. The problem states that 13% of U.S. adults know the care-instruction symbol for any bleach. This means the probability of knowing is 0.13. We are tasked with finding the probability of not knowing this symbol.
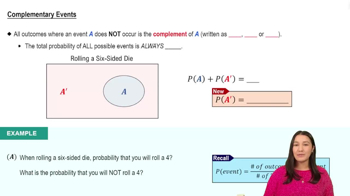
Step 2: Recall the complement rule in probability. The complement rule states that the probability of an event not occurring is equal to 1 minus the probability of the event occurring. Mathematically, this is expressed as: P(not A) = 1 - P(A).
Step 3: Substitute the given probability into the complement formula. Here, P(A) = 0.13, so P(not A) = 1 - 0.13.
Step 4: Perform the subtraction to find the probability of not knowing the symbol. This will give you the value of P(not A).
Step 5: Interpret the result. The final value represents the probability of randomly selecting an adult in the U.S. who does not know the care-instruction symbol for any bleach.

비슷한 문제에 대한 검증된 영상 답변:

이 영상 해법은 위 문제에 도움이 된다고 튜터들이 추천한 것입니다.
영상 길이:
1m
도움이 되었나요?

주요 개념

질문에 올바르게 답하기 위해 반드시 이해해야 하는 핵심 개념들은 다음과 같습니다.

Probability

Probability is a measure of the likelihood that a particular event will occur, expressed as a number between 0 and 1. In this context, it helps determine the chance of randomly selecting an adult who does not know the care-instruction symbol for bleach usage. The probability can be calculated by subtracting the known percentage from 100%.
추천 영상:
5:37
Introduction to Probability

Complementary Events

Complementary events are pairs of outcomes in a probability scenario where one event occurs if and only if the other does not. In this case, knowing the percentage of adults who understand the symbol allows us to find the complementary percentage of those who do not, which is essential for calculating the desired probability.
추천 영상:
4:23
Complementary Events

Random Sampling

Random sampling is a technique used to select a subset of individuals from a larger population, ensuring that each member has an equal chance of being chosen. This concept is crucial for the question as it assumes that the selected adult is representative of the entire U.S. adult population, allowing for valid probability calculations.
추천 영상:
05:11
Sampling Distribution of Sample Proportion
관련 실천
교과서 질문

Shared Birthdays Find the probability that of 25 randomly selected people, at least 2 share the same birthday.

187
views

교과서 질문

Unseen Coins A statistics professor tosses two coins that cannot be seen by any students. One student asks this question: “Did one of the coins turn up heads?” Given that the professor’s response is “yes,” find the probability that both coins turned up heads.

130
views
교과서 질문

California Lottery Let A denote the event of placing a \$1 straight bet on the California Daily 4 lottery and winning. There are 10,000 different ways that you can select the four digits (with repetition allowed) in this lottery, and only one of those four-digit numbers will be the winner. What is the value of P(A)? What is the value of P(Abar)?

238
views
교과서 질문

Notation What does the symbol ! represent? The five starting players of an NBA basketball team can stand in a line 5! different ways, so what is the actual number of ways that the five players can stand in a line?

231
views
교과서 질문

In Exercises 13–20, express the indicated degree of likelihood as a probability value between 0 and 1.


SAT Test When making a random guess for an answer to a multiple choice question on an SAT test, the possible answers are a, b, c, d, e, so there is 1 chance in 5 of being correct.

179
views
교과서 질문

In Exercises 21-28, find the probability and answer the questions.


YSORT Gender Selection MicroSort’s YSORT gender selection technique is designed to increase the likelihood that a baby will be a boy. At one point before clinical trials of the YSORT gender selection technique were discontinued, 291 births consisted of 239 baby boys and 52 baby girls (based on data from the Genetics & IVF Institute). Based on these results, what is the probability of a boy born to a couple using MicroSort’s YSORT method? Does it appear that the technique is effective in increasing the likelihood that a baby will be a boy?

181
views