


Ch. 4 - Probability
Triola - Elementary Statistics 14th Edition
Triola14th EditionElementary StatisticsISBN: 9780137366446당신이 사용하는 게 아니라요?교과서 변경
4장, 문제 4.5.1

Simulating Dice When two dice are rolled, the total is between 2 and 12 inclusive. A student simulates the rolling of two dice by randomly generating numbers between 2 and 12. Does this simulation behave in a way that is similar to actual dice? Why or why not?

검증된 단계별 안내
1
Understand the problem: When two dice are rolled, the total is the sum of the numbers on the two dice. Each die has numbers from 1 to 6, so the possible sums range from 2 (1+1) to 12 (6+6). The simulation involves generating random numbers between 2 and 12, but we need to determine if this accurately reflects the behavior of actual dice rolls.
Step 1: Analyze the probability distribution of actual dice rolls. For two dice, the probability of each sum is not uniform. For example, the sum of 7 has the highest probability because there are more combinations of dice rolls that result in 7 (e.g., 1+6, 2+5, 3+4, etc.) compared to sums like 2 or 12, which have only one combination each (1+1 and 6+6, respectively).
Step 2: Compare the simulation to the actual dice rolls. In the simulation, numbers between 2 and 12 are generated randomly, but if the simulation generates these numbers with equal probability, it does not accurately reflect the behavior of actual dice rolls. Actual dice rolls have a non-uniform probability distribution based on the number of combinations that produce each sum.
Step 3: Evaluate the implications of the simulation. If the simulation generates numbers between 2 and 12 with equal probability, it oversimplifies the behavior of dice rolls and does not account for the varying likelihood of different sums. This could lead to incorrect conclusions in analyses that rely on the probabilities of dice rolls.
Step 4: Suggest improvements to the simulation. To make the simulation behave similarly to actual dice rolls, it should generate sums based on the probability distribution of two dice. This can be achieved by simulating the rolling of two individual dice (generating two random numbers between 1 and 6) and then summing the results, which naturally produces the correct probability distribution.

비슷한 문제에 대한 검증된 영상 답변:

이 영상 해법은 위 문제에 도움이 된다고 튜터들이 추천한 것입니다.
영상 길이:
2m
도움이 되었나요?

주요 개념

질문에 올바르게 답하기 위해 반드시 이해해야 하는 핵심 개념들은 다음과 같습니다.

Probability Distribution

A probability distribution describes how the probabilities of a random variable are distributed across its possible values. In the case of rolling two dice, the total outcomes range from 2 to 12, with different probabilities for each total. For example, there is only one way to roll a 2 (1+1) but six ways to roll a 7 (1+6, 2+5, etc.), leading to a non-uniform distribution.
추천 영상:
가이드 코스
06:39
Calculating Probabilities in a Binomial Distribution

Randomness and Uniformity

Randomness refers to the unpredictability of outcomes in a process, while uniformity implies that each outcome has an equal chance of occurring. In the context of simulating dice, true randomness would mean that each total from 2 to 12 should not only be possible but also reflect the actual probabilities of those totals when rolling two dice, which is not the case if the simulation generates numbers uniformly.
추천 영상:
가이드 코스
07:09
Intro to Random Variables & Probability Distributions

Simulation Validity

Simulation validity assesses whether a simulated process accurately represents the real-world process it aims to mimic. For the dice simulation, it is crucial to compare the generated outcomes' distribution to the theoretical distribution of rolling two dice. If the simulation does not replicate the expected probabilities, it may lead to misleading conclusions about the behavior of actual dice.
추천 영상:
가이드 코스
05:18
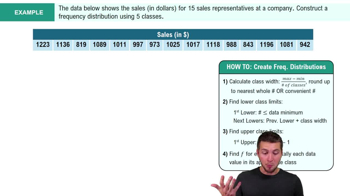
How to Create Frequency Distributions Example 2
관련 실천
교과서 질문

In Exercises 29–32, use the given sample space or construct the required sample space to find the indicated probability.


Three Children Use this sample space listing the eight simple events that are possible when a couple has three children (as in Example 2): {bbb, bbg, bgb, bgg, gbb, gbg, ggb, ggg}. Assume that boys and girls are equally likely, so that the eight simple events are equally likely. Find the probability that when a couple has three children, there is exactly one girl.

156
views
교과서 질문

Same Birthdays If 25 people are randomly selected, find the probability that no 2 of them have the same birthday. Ignore leap years.

215
views
교과서 질문

In Exercises 33–40, use the given probability value to determine whether the sample results are significant.


Voting Repeat Exercise 33 after replacing 40 Democrats being placed on the first line of voting ballots with 27 Democrats being placed on the first line. The probability of getting a result as high as 27 is 0.029792.

103
views
교과서 질문

In Exercises 33–40, use the given probability value to determine whether the sample results are significant.


Selfie Deaths Based on Priceonomics data describing 49 deaths while taking selfies, it was found that 37 of those deaths were males. Assuming that males and females are equally likely to have selfie deaths, there is a 0.000235 probability of getting 37 or more males. Is the result of 37 males significantly low, significantly high, or neither? Does the result suggest that male selfie deaths are more likely than female selfie deaths?

126
views
교과서 질문

In Exercises 9–12, assume that 100 births are randomly selected. Use subjective judgment to describe the given number of girls as (a) significantly low, (b) significantly high, or (c) neither significantly low nor significantly high.


53 girls.

126
views
교과서 질문

In Exercises 29–32, use the given sample space or construct the required sample space to find the indicated probability.


Four Children Exercise 29 lists the sample space for a couple having three children. After identifying the sample space for a couple having four children, find the probability of getting three girls and one boy (in any order).

197
views