


Ch. 6 - Normal Probability Distributions
Triola - Elementary Statistics 14th Edition
Triola14th EditionElementary StatisticsISBN: 9780137366446당신이 사용하는 게 아니라요?교과서 변경
6장, 문제 6.R.8a

In Exercises 8 and 9, assume that women have standing eye heights that are normally distributed with a mean of 59.7 in. and a standard deviation of 2.5 in. (based on anthropometric survey data from Gordon, Churchill, et al.).
a. If an eye recognition security system is positioned at a height that is uncomfortable for women with standing eye heights less than 54 in., what percentage of women will find that height uncomfortable?

검증된 단계별 안내
1
Step 1: Identify the key parameters of the normal distribution. The mean (μ) is 59.7 inches, and the standard deviation (σ) is 2.5 inches. The problem asks for the percentage of women with standing eye heights less than 54 inches.
Step 2: Standardize the value of 54 inches using the z-score formula: z = (X - μ) / σ. Here, X is the value of interest (54 inches), μ is the mean (59.7 inches), and σ is the standard deviation (2.5 inches). Substitute these values into the formula.
Step 3: Once the z-score is calculated, use a standard normal distribution table (z-table) or statistical software to find the cumulative probability corresponding to the calculated z-score. This cumulative probability represents the proportion of women with standing eye heights less than 54 inches.
Step 4: Convert the cumulative probability into a percentage by multiplying it by 100. This percentage represents the proportion of women who will find the eye recognition system height uncomfortable.
Step 5: Interpret the result in the context of the problem. State that this percentage represents the proportion of women whose standing eye heights are less than 54 inches, making the system height uncomfortable for them.

비슷한 문제에 대한 검증된 영상 답변:

이 영상 해법은 위 문제에 도움이 된다고 튜터들이 추천한 것입니다.
영상 길이:
2m
도움이 되었나요?

주요 개념

질문에 올바르게 답하기 위해 반드시 이해해야 하는 핵심 개념들은 다음과 같습니다.

Normal Distribution

Normal distribution is a probability distribution that is symmetric about the mean, indicating that data near the mean are more frequent in occurrence than data far from the mean. In this context, women's standing eye heights are normally distributed, which allows us to use statistical methods to determine probabilities related to specific height thresholds.
추천 영상:
09:47
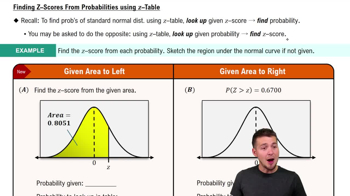
Finding Standard Normal Probabilities using z-Table

Z-Score

A Z-score measures how many standard deviations an element is from the mean. It is calculated by subtracting the mean from the value and then dividing by the standard deviation. In this problem, calculating the Z-score for the height of 54 inches will help determine the percentage of women whose eye heights fall below this threshold.
추천 영상:
06:31
Z-Scores From Given Probability - TI-84 (CE) Calculator

Percentile and Area Under the Curve

The percentile indicates the relative standing of a value within a dataset, showing the percentage of observations that fall below it. In the context of a normal distribution, the area under the curve to the left of a specific Z-score represents the percentage of women with eye heights less than that value, which is essential for answering the question about discomfort with the security system's height.
추천 영상:
08:50
Z-Scores from Probabilities
관련 실천
교과서 질문

Bone Density Test A bone mineral density test is used to identify a bone disease. The result of a bone density test is commonly measured as a z score, and the population of z scores is normally distributed with a mean of 0 and a standard deviation of 1.

e. If the mean bone density test score is found for 9 randomly selected subjects, find the probability that the mean is greater than 0.23.

179
views
교과서 질문

Arm Circumferences Arm circumferences of adult men are normally distributed with a mean of 33.64 cm and a standard deviation of 4.14 cm (based on Data Set 1 “Body Data” in Appendix B). A sample of 25 men is randomly selected and the mean of the arm circumferences is obtained.

b. What is the mean of all such sample means?

181
views
교과서 질문

In Exercises 8 and 9, assume that women have standing eye heights that are normally distributed with a mean of 59.7 in. and a standard deviation of 2.5 in. (based on anthropometric survey data from Gordon, Churchill, et al.).


Significance Instead of using 0.05 for identifying significant values, use the criteria that a value x is significantly high if P(x or greater) ≤ 0.01 and a value is significantly low if P(x or less) ≤ 0.01. Find the standing eye heights of women that separate significant values from those that are not significant. Using these criteria, is a woman’s standing eye height of 67 in. significantly high?

104
views
교과서 질문

Birth Weights Based on Data Set 6 “Births” in Appendix B, birth weights of girls are normally distributed with a mean of 3037.1 g and a standard deviation of 706.3 g.


b. What is the value of the median?

107
views
교과서 질문

Birth Weights Based on Data Set 6 “Births” in Appendix B, birth weights of girls are normally distributed with a mean of 3037.1 g and a standard deviation of 706.3 g.


c. What is the value of the mode?

115
views
교과서 질문

Mensa Membership in Mensa requires a score in the top 2% on a standard intelligence test. The Wechsler IQ test is designed for a mean of 100 and a standard deviation of 15, and scores are normally distributed.


a. Find the minimum Wechsler IQ test score that satisfies the Mensa requirement.

481
views