 뒤로
뒤로Graphs of Sine and Cosine Functions: Amplitude, Period, and Transformations
스터디 가이드 - 스마트 노트
 자료에 맞춘 맞춤형 노트, 핵심 정의, 예시, 맥락을 확장해 제공합니다.
Graphs of Sine and Cosine Functions
Basic Sine and Cosine Curves
The sine and cosine functions are fundamental periodic functions in trigonometry, with applications in modeling oscillatory phenomena. Their graphs exhibit repeating cycles, known as periods, and possess distinct symmetry properties.
Domain: All real numbers.
Range: Interval [−1, 1].
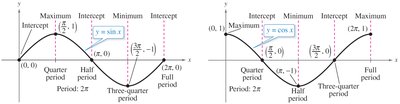
Period: for both sine and cosine.
Symmetry: Sine is odd (symmetric about the origin); cosine is even (symmetric about the y-axis).
Key Points: Each cycle contains intercepts, maximum, and minimum points.
Example: The graphs below show one period of the basic sine and cosine functions, highlighting key points.
Sketching Sine and Cosine Curves Using Key Points
To sketch the graphs by hand, identify five key points within one period: intercepts, maximum, and minimum values. For transformations such as vertical stretching, adjust the y-values accordingly.
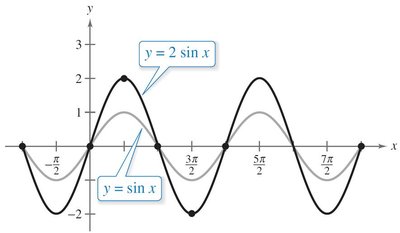
Example: For on , the amplitude is 2, so the y-values are doubled compared to .
Key Points: (intercept), (intercept), (maximum), (intercept), (minimum), (intercept).
Amplitude and Period of Sine and Cosine Functions
Amplitude
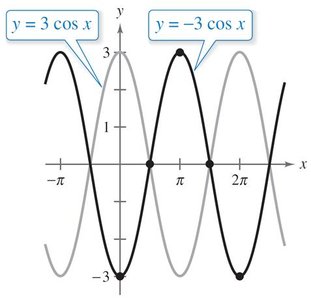
The amplitude of a sine or cosine function is the absolute value of the coefficient multiplying the function. It represents half the distance between the maximum and minimum values.
Formula: for or .
Range: .
Reflection: If , the graph is reflected about the x-axis.
Period
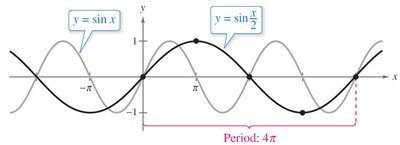
The period of a sine or cosine function is determined by the coefficient of x inside the function. It describes the length of one complete cycle.
Formula: for or .
Horizontal Stretch/Shrink: If , the period increases (stretch); if , the period decreases (shrink).
Negative b: Use even/odd properties: (reflection), (no change).
Transformations of Sine and Cosine Functions
Horizontal Translation (Phase Shift)
The constant c in or causes a horizontal shift, known as the phase shift. The graph completes one cycle from to .
Phase Shift: units to the right if , to the left if .
Cycle Interval: .
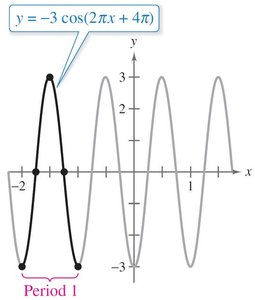
Vertical Translation
The constant d in or shifts the graph vertically. The graph oscillates about the line instead of the x-axis.
Vertical Shift: d units up if , d units down if .
Summary Table: Characteristics of Sine and Cosine Graphs
Parameter | Effect |
|---|---|
a | Amplitude (vertical stretch/shrink, reflection if negative) |
b | Period (horizontal stretch/shrink) |
c | Phase shift (horizontal translation) |
d | Vertical shift (oscillation about y = d) |
Mathematical Modeling with Sine and Cosine Functions
Modeling Real-Life Data
Sine and cosine functions are used to model periodic phenomena such as tides, sound waves, and seasonal variations. The amplitude, period, phase shift, and vertical shift are determined from the data.
Example: Modeling water depth at a dock using a cosine function.
Amplitude: Half the difference between maximum and minimum depth.
Period: Twice the time between maximum and minimum depth.
Phase Shift: Determined by the time of maximum depth.
Vertical Shift: Average of maximum and minimum depth.
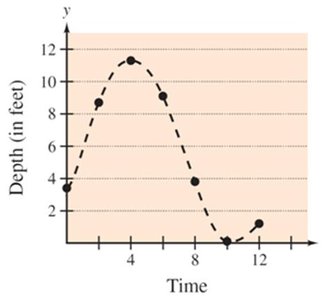
Model:
Applications: Predicting Values and Safe Intervals
Predicting Depth: Substitute t values into the model to find depth at specific times.
Safe Docking Interval: Use the model to determine when depth exceeds a threshold (e.g., 10 feet).
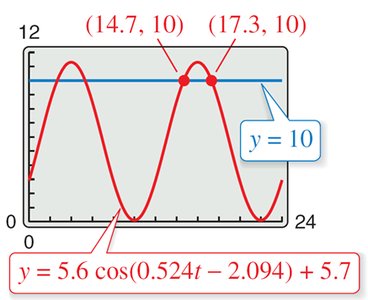
Additional info: Sine and cosine models are widely used in engineering, physics, and environmental science to analyze and predict periodic behavior.
