Ch. 2 - Graphs of the Trigonometric Functions; Inverse Trigonometric Functions
Blitzer - Trigonometry 3rd Edition
Blitzer3rd EditionTrigonometryISBN: 9780137316601당신이 사용하는 게 아니라요?교과서 변경
2장, 문제 62

In Exercises 61–66, use the method of adding y-coordinates to graph each function for 0 ≤ x ≤ 2π. y = 3 cos x + sin x

검증된 단계별 안내
1
Identify the given function: \(y = 3 \cos x + \sin x\). We want to graph this function for \(0 \leq x \leq 2\pi\) by adding the \(y\)-coordinates of the individual trigonometric functions \(3 \cos x\) and \(\sin x\).
Create a table of values for \(x\) at key points within the interval \([0, 2\pi]\), such as \(0\), \(\frac{\pi}{2}\), \(\pi\), \(\frac{3\pi}{2}\), and \(2\pi\). For each \(x\), calculate \(3 \cos x\) and \(\sin x\) separately.
For each \(x\) value, add the corresponding \(y\)-coordinates: \(y = 3 \cos x + \sin x\). This means summing the values found for \(3 \cos x\) and \(\sin x\) at each \(x\).
Plot the points \((x, y)\) on the coordinate plane using the summed \(y\)-values from the previous step. This will give you points on the graph of the function \(y = 3 \cos x + \sin x\).
Connect the plotted points smoothly, keeping in mind the periodic and wave-like nature of sine and cosine functions, to complete the graph over the interval \(0 \leq x \leq 2\pi\).

비슷한 문제에 대한 검증된 영상 답변:

이 영상 해법은 위 문제에 도움이 된다고 튜터들이 추천한 것입니다.
영상 길이:
8m
도움이 되었나요?

주요 개념

질문에 올바르게 답하기 위해 반드시 이해해야 하는 핵심 개념들은 다음과 같습니다.

Graphing Trigonometric Functions

Graphing trigonometric functions involves plotting points based on their values at various x-coordinates, typically within one period such as 0 to 2π. Understanding the shape and behavior of sine and cosine functions helps in visualizing their graphs and how they combine.
추천 영상:
6:04
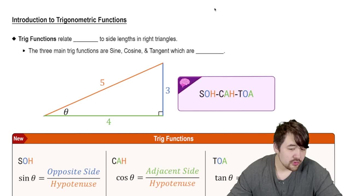
Introduction to Trigonometric Functions

Superposition of Functions (Adding y-coordinates)

When combining functions like y = 3 cos x + sin x, the graph is formed by adding the y-values of each function at corresponding x-values. This method, called superposition, helps in constructing the resultant graph by pointwise addition of the individual function values.
추천 영상:
6:02
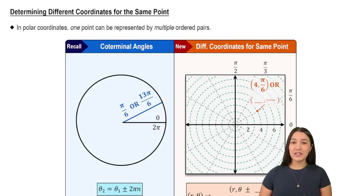
Determining Different Coordinates for the Same Point

Amplitude and Phase Shift in Combined Trigonometric Functions

The combination y = 3 cos x + sin x can be rewritten as a single sinusoidal function with a specific amplitude and phase shift. Understanding how to find this equivalent form helps in analyzing the maximum and minimum values and the horizontal shift of the graph.
추천 영상:
6:31
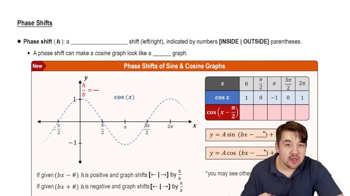
Phase Shifts