Ch. 4 - Graphs of the Circular Functions
Lial - Trigonometry 12th Edition
Lial12th EditionTrigonometryISBN: 9780136552161당신이 사용하는 게 아니라요?교과서 변경
5장, 문제 4.35

Graph each function over a two-period interval. Give the period and amplitude. See Examples 2–5.
y = -2 sin 2 πx

검증된 단계별 안내
1
Identify the standard form of the sine function, which is \( y = a \sin(bx + c) + d \). In this case, \( y = -2 \sin(2\pi x) \).
Determine the amplitude of the function. The amplitude is the absolute value of the coefficient \( a \). Here, \( a = -2 \), so the amplitude is \(|-2| = 2\).
Find the period of the function. The period of a sine function is given by \( \frac{2\pi}{b} \), where \( b \) is the coefficient of \( x \). In this case, \( b = 2\pi \), so the period is \( \frac{2\pi}{2\pi} = 1 \).
Graph the function over a two-period interval. Since the period is 1, a two-period interval would be from \( x = 0 \) to \( x = 2 \).
Plot key points of the sine function within the interval, considering the amplitude and period. The key points for one period of \( y = \sin(x) \) are at \( x = 0, \frac{1}{4}, \frac{1}{2}, \frac{3}{4}, 1 \). Adjust these points for the given function \( y = -2 \sin(2\pi x) \).

비슷한 문제에 대한 검증된 영상 답변:

이 영상 해법은 위 문제에 도움이 된다고 튜터들이 추천한 것입니다.
도움이 되었나요?

주요 개념

질문에 올바르게 답하기 위해 반드시 이해해야 하는 핵심 개념들은 다음과 같습니다.

Period of a Trigonometric Function

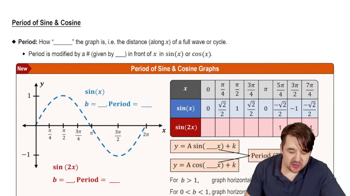
The period of a trigonometric function is the length of one complete cycle of the wave. For the sine function, the standard period is 2π. However, when the function is modified, such as in y = -2 sin(2πx), the period can be calculated by dividing the standard period by the coefficient of x, which in this case is 2π, resulting in a period of 1.
추천 영상:
5:33
Period of Sine and Cosine Functions

Amplitude of a Trigonometric Function

The amplitude of a trigonometric function refers to the maximum distance the function reaches from its midline. In the function y = -2 sin(2πx), the amplitude is given by the absolute value of the coefficient in front of the sine function, which is 2. This means the graph will oscillate between -2 and 2, but since the sine function is negated, it will reflect the wave vertically.
추천 영상:
6:04
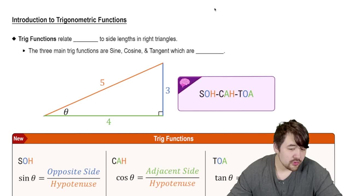
Introduction to Trigonometric Functions

Graphing Sine Functions

Graphing sine functions involves plotting the values of the function over a specified interval. For y = -2 sin(2πx), the graph will show a wave that oscillates between -2 and 0, with a period of 1. Understanding how to identify key points, such as the maximum, minimum, and intercepts, is essential for accurately representing the function over the given interval.
추천 영상:
5:53
Graph of Sine and Cosine Function