Ch. 4 - Graphs of the Circular Functions
Lial - Trigonometry 12th Edition
Lial12th EditionTrigonometryISBN: 9780136552161당신이 사용하는 게 아니라요?교과서 변경
5장, 문제 4.13

Graph each function over the interval [-2π, 2π]. Give the amplitude. See Example 1.
y = 2 cos x

검증된 단계별 안내
1
Identify the function type: The given function is a cosine function, specifically \( y = 2 \cos x \).
Determine the amplitude: The amplitude of a cosine function \( y = a \cos x \) is the absolute value of \( a \). Here, \( a = 2 \), so the amplitude is \( |2| = 2 \).
Set the interval for graphing: The problem specifies the interval \([-2\pi, 2\pi]\). This means you will graph the function from \(-2\pi\) to \(2\pi\).
Plot key points: For \( y = 2 \cos x \), identify key points within one period \([0, 2\pi]\) such as \( (0, 2), (\pi/2, 0), (\pi, -2), (3\pi/2, 0), (2\pi, 2) \) and extend this pattern to cover the interval \([-2\pi, 2\pi]\).
Sketch the graph: Use the key points and the amplitude to sketch the cosine wave, ensuring it oscillates between \(-2\) and \(2\) over the specified interval.

비슷한 문제에 대한 검증된 영상 답변:

이 영상 해법은 위 문제에 도움이 된다고 튜터들이 추천한 것입니다.
도움이 되었나요?

주요 개념

질문에 올바르게 답하기 위해 반드시 이해해야 하는 핵심 개념들은 다음과 같습니다.

Amplitude

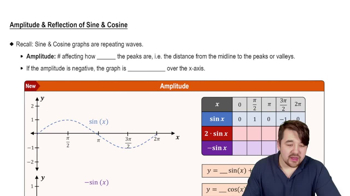
Amplitude refers to the maximum distance a wave reaches from its central axis. In the context of trigonometric functions like cosine, it indicates how tall the peaks and how deep the troughs of the graph are. For the function y = 2 cos x, the amplitude is 2, meaning the graph oscillates between 2 and -2.
추천 영상:
5:05
Amplitude and Reflection of Sine and Cosine

Cosine Function

The cosine function is a fundamental trigonometric function defined as the ratio of the adjacent side to the hypotenuse in a right triangle. It is periodic, with a period of 2π, meaning it repeats its values every 2π units. The graph of y = cos x is a wave that oscillates between 1 and -1, and when multiplied by a coefficient, like 2 in this case, it stretches vertically.
추천 영상:
5:53
Graph of Sine and Cosine Function

Graphing Trigonometric Functions

Graphing trigonometric functions involves plotting their values over a specified interval, which helps visualize their periodic nature. For y = 2 cos x over the interval [-2π, 2π], one would plot points at key angles (like 0, π/2, π, etc.) and connect them to show the wave pattern. Understanding the key features such as amplitude, period, and phase shift is essential for accurate graphing.
추천 영상:
6:04
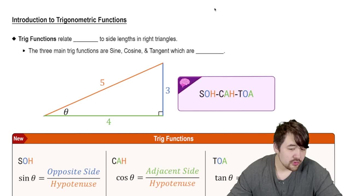
Introduction to Trigonometric Functions