Ch. R - Algebra Review
Lial - Trigonometry 12th Edition
Lial12th EditionTrigonometryISBN: 9780136552161당신이 사용하는 게 아니라요?교과서 변경
1장, 문제 23

Graph each function. See Examples 1 and 2. ƒ(x) = -½ x²

검증된 단계별 안내
1
Identify the type of function given. Here, ƒ(x) = -\(\frac{1}{2}\) x^{2} is a quadratic function, which graphs as a parabola.
Note the coefficient of x², which is -\(\frac{1}{2}\). Since it is negative, the parabola opens downward, and the factor \(\frac{1}{2}\) affects the width, making it wider than the standard parabola y = -x².
Determine the vertex of the parabola. For the function ƒ(x) = a x^{2} + bx + c, the vertex is at x = -\(\frac{b}{2a}\). Here, b = 0, so the vertex is at x = 0. Calculate ƒ(0) to find the vertex point.
Create a table of values by choosing x-values around the vertex (for example, x = -2, -1, 0, 1, 2), then compute the corresponding y-values using the function ƒ(x) = -\(\frac{1}{2}\) x^{2}.
Plot the points from the table on the coordinate plane and draw a smooth curve through them to complete the graph of the parabola.

비슷한 문제에 대한 검증된 영상 답변:

이 영상 해법은 위 문제에 도움이 된다고 튜터들이 추천한 것입니다.
영상 길이:
6m
도움이 되었나요?

주요 개념

질문에 올바르게 답하기 위해 반드시 이해해야 하는 핵심 개념들은 다음과 같습니다.

Quadratic Functions and Their Graphs

A quadratic function is a polynomial of degree two, typically written as f(x) = ax² + bx + c. Its graph is a parabola that opens upwards if a > 0 and downwards if a < 0. Understanding the shape and orientation of the parabola is essential for graphing.
추천 영상:
6:36
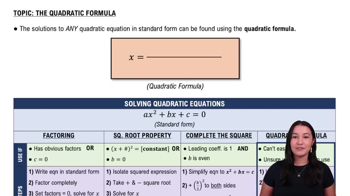
Quadratic Formula

Effect of the Leading Coefficient

The leading coefficient (a) affects the width and direction of the parabola. A negative coefficient, like -½, flips the parabola downward, while its absolute value controls how 'wide' or 'narrow' the curve appears. Smaller absolute values make the parabola wider.
추천 영상:
6:24
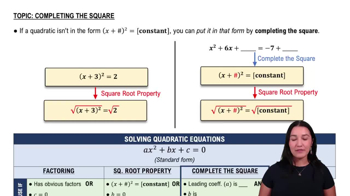
Solving Quadratic Equations by Completing the Square

Plotting Key Points and Vertex

To graph a quadratic function, identify the vertex (the highest or lowest point) and plot additional points by substituting x-values. For f(x) = -½ x², the vertex is at the origin (0,0), and points on either side help define the parabola's shape.
추천 영상:
4:29
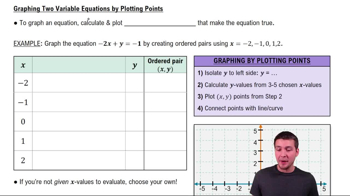
Graphing Two Variable Equations by Plotting Points