What does increasing marginal opportunity cost mean in the context of a production possibilities frontier (PPF)?
Increasing marginal opportunity cost means that as more of one good is produced, the opportunity cost of producing additional units of that good rises. This is shown by a PPF that bows outward, indicating that each additional unit of a good requires giving up more and more of the other good.
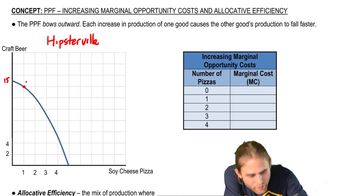
How is increasing marginal opportunity cost illustrated on a PPF graph?
It is illustrated by a PPF that bows outward, showing that as production of one good increases, the amount of the other good that must be given up increases for each additional unit produced.
Why does the opportunity cost increase as more of a good is produced?
The opportunity cost increases because resources are not equally efficient in producing all goods. As more resources are shifted to produce one good, less suitable resources are used, making production less efficient and increasing the cost in terms of the other good given up.
What is the relationship between increasing marginal opportunity cost and allocative efficiency?
Allocative efficiency occurs where the marginal benefit of a good equals its marginal cost, which reflects the increasing marginal opportunity cost. The efficient mix of goods is found where consumer preferences (marginal benefit) match the rising marginal cost of production.
How does the marginal cost of producing soy cheese pizza change as more pizzas are produced, according to the example in the topic summary?
The marginal cost increases with each additional pizza: the first pizza costs 1 craft beer, the second costs 2, the third costs 3, and so on, demonstrating increasing marginal opportunity cost.
Producing additional units of a good requires giving up increasingly larger amounts of the other good, due to the less efficient allocation of resources.
Why do we use the arc method when plotting the marginal cost curve for pizza production?
The arc method is used to find the average slope between two points on a curved PPF, so marginal costs are plotted at the midpoint between quantities to accurately reflect changes in opportunity cost.
How does the marginal benefit of soy cheese pizza change as more pizzas are produced?
The marginal benefit decreases with each additional pizza produced, meaning consumers value the first units more highly than subsequent ones.
What information does the PPF graph alone not provide when determining allocative efficiency?
The PPF graph does not provide information about consumer preferences or marginal benefit; these must be given separately to find the allocatively efficient mix.
At what point is allocative efficiency achieved in the example, and why?
Allocative efficiency is achieved at 2.5 pizzas and 10 craft beers, where the marginal benefit equals the marginal cost, reflecting the optimal mix for consumer preferences.
How does a production possibilities curve (PPC) illustrate opportunity cost, especially when marginal opportunity costs are increasing?
A production possibilities curve (PPC) illustrates opportunity cost by showing the trade-offs between producing two goods. When the PPC bows outward, it reflects increasing marginal opportunity costs: as more of one good is produced, increasingly larger amounts of the other good must be given up. This means the opportunity cost of each additional unit rises, which is shown by the steeper slope of the curve as you move along it. For example, producing each additional pizza requires giving up more craft beers than the previous pizza, demonstrating the concept of increasing opportunity cost.
 Back
Back
 08:42
08:42