Pearson+ LogoPearson+ Logo
Start typing, then use the up and down arrows to select an option from the list.

Microeconomics

Learn the toughest concepts covered in Microeconomics with step-by-step video tutorials and practice problems by world-class tutors

Introductory Economic Models

PPF - Increasing Marginal Opportunity Costs and Allocative Efficiency

The more you want of something, the more you have to give up to get it. Economics dishing out those hard truths!
1
concept

Increasing Marginal Opportunity Costs

clock
4m
Play a video:
Was this helpful?
So now we're gonna continue with the PPF with the discussion of increasing marginal opportunity costs. So when you look at a graph of a PPF, like you see on the left here, we've got the graph for hipster ville, I'm gonna call it here where they produce craft beer and soy cheese pizza, right? When we look at the graph um when you see the graph has a shape that it kind of bows outward, right? It's not this straight line just connecting these two points from one to the other. No, it's got this shape, that boat outward. And the point of that is to describe this situation of increasing marginal opportunity costs. So the idea is that as we increase the production of one good, say soy cheese pizza, it's gonna cost us more and more of the production of the other good. So the idea is as we increase the production of soy cheese pizza, it's gonna become marginally more expensive. So let's look at this graph and let's see how that works here. Um So the idea, remember when we're talking about marginal opportunity costs, what's the opportunity cost of one more, So what's it gonna cost us for one more pizza in this case? So when we're at zero and we want to move up to one pizza, when we have zero pizzas, we are noticed this graph goes up by 2468, 10. This spot right here is 15 on the graph. Um And when we moved to one. So when we create our first pizza, we are gonna get less craft beer, right? So when we had zero pizza, we had 15 craft beers up there. And now it's gonna move us down to 14 craft beers here on the graph. So this is 68, 10, 12, 14. And then 15 right there where it crosses. Um So what what did we give up to get this first pizza? Right, We started at 15, and now we're at 14, we gave up one P one craft beer to get to that first pizza, right? We had 15 craft beers. Now We have 14 craft beers. The marginal cost is going to be one of that first pizza. So now what about that second pizza? Now the marginal cost. Remember, it's how much for one more pizza? We already have one pizza. How much for that second one in this case. So here we started with one pizza. What happens when we move over to the second pizza? It looks like we lose two beers in this case, right? We had 14 beers. Now we're down to 12 beers. Once we get to the second pizza. So, the marginal cost of that pizza is going to be too, right? When we got one pizza, the marginal cost of the next pizza is two. Let's do the same thing with the next one. So here we were at 12 beers. And then we moved down to this point right here, which is in the middle of the graph. That's at nine right there. Um So here we are giving up three beers, right? We were at 12. Now we are down to nine beers once we have that third pizza. So our marginal cost when we have two pizzas of adding one more pizza is three beers. So that that third pizza, right? Um So now let's try the next one. Right? Now, we already have three pizzas. How much is that? Fourth one gonna cost us? So, we start here at nine. We're gonna find where it goes down to and that's right here in the middle again. Now we're at five. So, we had nine pizzas, Excuse me, nine beers. And we had to give up four of those beers to get that fourth pizza. So the marginal cost when we have three pizzas of the fourth pizza is going 24 beers in this case, right? We had nine beers and we had to give up four of them to get to that fourth pizza. And last, but not least. What about when we want five pizzas? So, we're at four. We wanna have 1/5 pizza. We're gonna have to give up all the rest of those beers. We were at five. Now we're at zero. So, the opportunity cost of that last pizza is going to be five. So, notice we've got increasing marginal opportunity costs, right? The more we wanted something, the more we have to give up. And if you were to do this the other way, you would see the same thing. We'd have to be giving up more and more pizza to get beers. All right, cool. Yeah.
2
concept

Allocative Efficiency with Marginal Analysis

clock
8m
Play a video:
Was this helpful?
Alright. So now let's see how this idea of increasing marginal opportunity cost relates to allocated efficiency. So remember allocated efficiency, it um deals with consumer preferences, right? It has. It's a little more subjective in what is the right amount, how much craft beer should we have? How much soy cheese pizza should we have? And we have to find the right mix for the that um for those consumers. So allocated efficiency is the mix of production where our marginal Ben, if it equals our marginal cost. You guys remember this formula I told you it was gonna come up again, marginal benefit equals marginal cost. Right? So, the benefit of producing this much equals the cost of producing this much. That is where we're gonna have the efficient point. Alright, And a few quick notes before we head to the graph down here, um is the idea that marginal benefit um is completely unrelated to the PPF. PPF is not telling us anything about the marginal benefit. How much do people want soy cheese pizza? How much do people want craft beer? We can't derive that information from that craft. All right, I'm gonna have to give you that information separately about marginal benefit. Um Your teacher's gonna have to give it to you, right? You're just not gonna be able to come up with it on your own. So, another note here, when we plot the marginal curve, um or excuse me, the marginal cost curve. Um We're going to do it from the midpoint of each unit. And this goes back to that idea of uh the arc method of of finding the slope on a curve. So here, since we don't have a straight line, we would be using the Arc method. Um And if you remember from the graphing review, basically, we're finding the average slope. Um So we're gonna do the same thing and we're gonna take it from the average of the amount of pizzas. So instead of going from 01234, we're gonna go from the midpoint from the half pizza the 1.5. Right? And that's because we're using the average slope, we're gonna use the average on the graph as well. So, we're gonna go from the midpoint. Alright, So here, on the graph, um it's a little different than the graph above, above. We had soy cheese pizza and craft beers on the graph here, we have soy cheese pizza, and the marginal cost and marginal benefit in craft beer. So, it's not um the total amount of craft that we're gonna be producing. We're talking about the marginal cost or the marginal benefit from this amount of pizza production. Right? So, if we're gonna produce this many pizzas, what's the marginal cost, what's the marginal benefit? All right. So, let's start with the marginal cost curve. And then I'll give you the marginal benefit numbers, and we will plug it in there. So, remember up above, we talked about the marginal cost of the first pizza, right? When we've got zero pizzas, and we want the first pizza, That marginal cost is one. So we're gonna plot that here for our marginal cost curve um at one, right? And we're gonna do that for all the other ones too, right? It went 12345 as we moved along the PPF. And those were our increasing marginal cost, right? That's why we see this number keep increasing here. So as we add pizzazz, so does our marginal cost increase. Alright. And what I'm gonna do is for our, let me get out of the way, for our marginal benefit. We're gonna describe this as the willingness to pay, right? So the idea is that for that first pizza, they don't have any pizza left pizza yet, they're gonna have a high willingness to pay. They really want that pizza. It's gonna be worth a lot to them when they first, when they get the first pizza. So, I'm gonna put in some numbers here, I'm gonna go five for that first pizza, four for the next 1321, right? And the idea here is that as we get more pizzas, we don't get as much benefit out of them because That's how it works. The first ones are always worth more to us than future ones, right? It's just like if you got your first Lamborghini, it's gonna mean a lot more to you than when you have 10 Lamborghinis, right? Once you're a professional micro economist and you're making all that money. you're gonna really cherish that first Lamborghini than that. 10 to 1. So let's go ahead and put these on the graph. We've got soy cheese pizza on the X axis, are marginal cost, marginal benefit in craft beers on the y axis. So let's go ahead. So for 0.5 pizzas, so it's right here in the middle of zero and one we're gonna have, let's start with just the marginal cost, we're going to have a marginal cost of one and for the next set of pizzas. And remember we're using the the average here right, we're going in the middle because it's the average slope and it's the average distance from 0 to 1. So we're gonna start in the middle um From 1 to 2 we've got to three was three go 345 here along the side four and then five. So here were are five points for our marginal cost curve 12345. And I'm gonna go ahead and connect those right now. So we've got a marginal cost curve looks something like that. I'll put marginal cost out there, notice how it goes up. Um As we increase our soy cheese pizza production. Let's do the same thing with marginal benefit. I'll get back out of the way. So we see the numbers. So our marginal benefit. Remember I just gave these to you, you can't derive these marginal benefits from anywhere. Um they have to be given or else you won't be able to figure this out. So at 0.5 pizzas, I'm gonna use blue for our marginal benefit. Um We've got five is our marginal benefit here. So that means we really value that first pizza because we don't have any yet. And the idea is the less of something. We have, the more we value it. So the next one here is four when we have between one and two pizzas and then right here, notice what just happened, right, I just bubbled on top of another bubble. You can maybe think of what that point is gonna be. Um so continuing on marginal benefit of two when we have 3.5 and then at 4.5, marginal benefit of one. So, I'm gonna connect these dots to make our curve here and that is our marginal benefit curve. And what were we talking about? Right we were saying that the allocated efficiency is where the marginal benefit equals the marginal cost. Can you find that here on the graph that is going to be this point right here. And that is when we are producing 2.5 million pizzas. Right, So what is the allocated efficiency quantity? Right. Um we know that 2.5 pizzas is the correct amount, but this graph right here, it doesn't tell us anything about the amount of craft beers that we want. Right? So in this box, at the bottom, we want to know the the efficient quantity of pizza and the efficient quantity of craft beers as well. So we do know that the soy cheese pizzas was 2.5. Um But we need to go back up to the graph to find out how many craft beers we make, when we've got 2.5 pizzas, Right? That other graph isn't telling us anything about the total amount of craft beer. So we're gonna go to 2.5 here, go up to the graph and we're gonna see that we're gonna want, oops, excuse me. Yeah. So we've got 2.5, get my pen back. We're gonna say we want, let's say that's 10 right there. Right, so 2.5 Million Pizzas and 10 craft beers. That is going to be our efficient quantity, right? There are allocated efficient quantity. Notice that that's also productively efficient, right? Because we are on the graph, there, we are on the PPF line. So that's productively efficient. And it's also allocated lee efficient based on our marginal benefit and our marginal cost. Cool, let's move on.
3
Problem

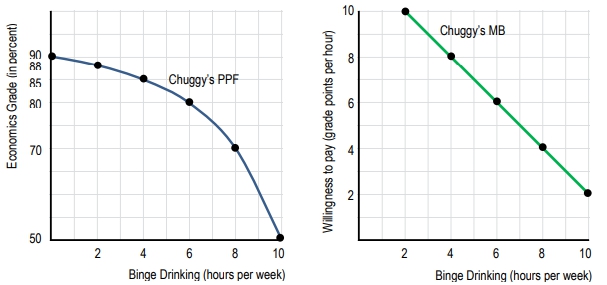
Chuggy wants to earn a high grade in his microeconomics class, but also loves going to parties and binge drinking. The first graph illustrates Chuggy’s PPF. The second graph denotes his MB curve from binge drinking.

What is Chuggy’s marginal cost of binge drinking if he parties for three hours a week? 

4
Problem

If Chuggy achieves allocative efficiency, how many hours does he spend binge drinking per week?

5
Problem

What is Chuggy’s economics grade when he achieves allocative efficiency?

Divider