 Back
BackApplying the Supply-and-Demand Model: Elasticity, Shocks, and Taxes
Study Guide - Smart Notes
 Tailored notes based on your materials, expanded with key definitions, examples, and context.
Applying the Supply-and-Demand Model
Overview
This chapter explores how the shapes of demand and supply curves influence market outcomes, focusing on elasticity, the effects of shocks, and the impact of taxes. Understanding these concepts is crucial for analyzing real-world market responses to changes in prices, income, and government policies.
How the Shapes of Demand and Supply Curves Matter
Impact of Curve Shapes on Market Equilibrium
Shape Importance: The steepness or flatness of demand and supply curves determines how much a shock (such as a price change or supply shift) affects equilibrium price and quantity.
Example: In the pork market, a $0.25 increase in the price of pork shifts the supply curve to the left, causing a movement along the demand curve and a reduction in quantity. The magnitude of these changes depends on the elasticity of demand.

Elasticity: Sensitivity of Quantity Demanded and Supplied
Price Elasticity of Demand
Definition: Elasticity measures the percentage change in one variable in response to a percentage change in another variable.
Price Elasticity of Demand (\(\varepsilon\)): The percentage change in quantity demanded resulting from a 1% change in price.
Formula:
Example: If a 1% increase in price leads to a 3% decrease in quantity demanded, then \(\varepsilon = -3\).
Elasticity on a Linear Demand Curve
Linear Demand Function:
Elasticity at a Point:
Example: For pork, . At , , .
Elasticity Along the Demand Curve
Elasticity varies along a linear demand curve: it is more negative (elastic) at higher prices and less negative (inelastic) at lower prices.
Types of Elasticity:
Elastic:
Inelastic:
Unitary:
Perfectly Elastic:
Perfectly Inelastic:

Perfectly Elastic and Inelastic Demand
Perfectly Elastic: Any price increase causes quantity demanded to drop to zero.
Perfectly Inelastic: Quantity demanded does not change with price.

Elasticity and Revenue
Relationship Between Elasticity and Revenue
When demand is elastic, a price increase reduces total revenue.
When demand is inelastic, a price increase increases total revenue.
 ]
]
Elasticities Over Time
Short-Run vs. Long-Run Elasticities
Elasticities often increase in the long run as consumers and producers have more time to adjust.
For durable or easily storable goods, short-run elasticities may be higher.
Other Elasticities of Demand
Income Elasticity of Demand
Definition: Measures the percentage change in quantity demanded in response to a 1% change in income.
Formula:
Example: If a 1% increase in income leads to a 3% increase in quantity demanded, .
Cross-Price Elasticity of Demand
Definition: Measures the percentage change in quantity demanded of one good in response to a 1% change in the price of another good.
Formula:
Interpretation:
Positive: Goods are substitutes (e.g., roses and carnations).
Negative: Goods are complements (e.g., peanut butter and jelly).
Elasticity of Supply
Price Elasticity of Supply
Definition: Measures the percentage change in quantity supplied in response to a 1% change in price.
Formula:
Example: For pork, . At , , .

Supply Elasticities Over Time
Supply elasticity is typically higher in the long run as firms can adjust all inputs.
Effects of a Sales Tax
Types of Sales Taxes
Ad Valorem Tax: A percentage of the sale price (e.g., VAT).
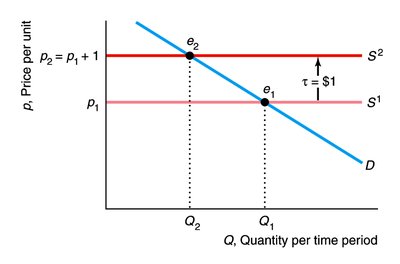
Specific Tax: A fixed amount per unit sold (e.g., $1 per kg).
Tax Incidence and Market Effects
A tax on producers shifts the supply curve upward (or leftward) by the amount of the tax.
A tax on consumers shifts the demand curve downward (or leftward) by the amount of the tax.
The division of the tax burden between buyers and sellers depends on the relative elasticities of supply and demand.
The equilibrium outcome is the same regardless of whether the tax is levied on buyers or sellers.


Tax Incidence and Elasticity
If supply is perfectly elastic, consumers bear the full burden of the tax.
If supply is perfectly inelastic, producers bear the full burden of the tax.
The more inelastic side of the market bears a greater share of the tax burden.

Ad Valorem vs. Specific Taxes
Ad valorem taxes are proportional to price, while specific taxes are fixed per unit.
The economic incidence and market effects can differ, especially if demand or supply is not linear.
Applications and Practice Problems
Elasticity in Practice
Elasticity values differ across goods, countries, and time periods.
Practice problems involve calculating elasticity, predicting revenue changes, and analyzing tax incidence.
Case Study: Oil Market and ANWR Production
Given demand elasticity (\(\varepsilon = -0.4\)), supply elasticity (\(\eta = 0.3\)), and a supply shock (e.g., new oil production), the effect on world price and quantity can be calculated using elasticity formulas.

Case Study: Gasoline Tax in Short Run vs. Long Run
The effect of a specific gasoline (carbon) tax differs in the short run and long run due to differences in supply and demand elasticities.
Additional info: These notes expand on the provided slides by including definitions, formulas, and examples for all elasticity concepts, as well as the effects of taxes and shocks on market equilibrium. All equations are provided in LaTeX format for clarity.
