 Back
Chapter 1: The Nature of Economics – Microeconomics Study Notes
Study Guide - Smart Notes
 Tailored notes based on your materials, expanded with key definitions, examples, and context.
Chpt 1. The Nature of Economics
Defining Economics
Economics is a social science concerned with how individuals, firms, and societies allocate limited resources to satisfy unlimited wants. It analyzes human behavior and decision-making under conditions of scarcity.
Scarcity: The fundamental economic problem of having limited resources to meet unlimited wants.
Trade-offs: Choices must be made because resources are limited.
Social Science: Economics studies human behavior, unlike physical sciences which study non-human phenomena.
Microeconomics vs. Macroeconomics
Economics is divided into two main branches: microeconomics and macroeconomics. Microeconomics focuses on individual agents and markets, while macroeconomics examines the economy as a whole.
Microeconomics: Studies decision-making by individuals, households, and firms. Examples include the effects of price changes on specific goods or industries.
Macroeconomics: Studies aggregate economic phenomena such as unemployment, inflation, and national income.
Modern Theory: Blends micro and macro concepts for comprehensive analysis.
The Three Basic Economic Questions
Every economic system must answer three fundamental questions:
What and how much will be produced?
How will items be produced?
For whom will items be produced?
Economic Systems: Centralized vs. Decentralized
There are two main types of economic systems that answer these questions:
Centralized Command and Control: Authority makes all economic decisions (central planning).
Price System (Market System): Decentralized decision-making, where prices act as signals for exchanges.
Mixed Systems: Most nations, including Canada, use a mix of both systems.
The Economic Approach: Rationality and Incentives
Microeconomics assumes rationality, meaning individuals act in their self-interest and respond predictably to opportunities for gain. Choices are made by weighing costs and benefits, and incentives can alter these decisions.
Rationality Assumption: Individuals do not intentionally make decisions that leave them worse off.
Self-interest: Pursuit of personal goals, including wealth, prestige, friendship, and love.
Incentives: Rewards (positive) or penalties (negative) that influence decision-making.
Economics as a Science
Economics uses empirical methods to create and test models and theories. Evidence and data are used to evaluate the usefulness of models, often through econometrics.
Empirical Science: Relies on observed data and correlation.
Econometrics: The application of statistical methods to economic data.
Assumptions: Models are based on assumptions to isolate variable effects.
Ceteris Paribus: Latin for "all other things being equal"; used to focus on the effect of one variable at a time.
Example: If Dodge lowers the price of its Ram truck, what happens to the price of Toyota Tundra, assuming all other factors remain constant?
Behavioral Economics
Behavioral economics studies consumer behavior with an emphasis on psychological limitations and complications that may interfere with rational decision-making. It introduces the concept of bounded rationality.
Bounded Rationality: People are nearly, but not fully, rational; they seek satisfactory solutions rather than optimal ones.
Rules of Thumb: Used to simplify decision-making, sometimes leading to suboptimal outcomes.
Limitations: Unbounded selfishness, willpower, and rationality are unrealistic assumptions.
Positive vs. Normative Economics
Economics distinguishes between positive and normative analysis:
Positive Economics: Based on statements that can be tested by observing facts ("what is").
Normative Economics: Based on value judgments ("what ought to be").
Examples:
"Increasing the minimum wage will reduce employment opportunities for young people." (Positive)
"A teacher should earn a higher salary than a hockey player." (Normative)
Appendix A: Reading and Working with Graphs
Variables in Economics
Graphs are used to illustrate relationships between economic variables.
Independent Variable: Value determined outside the equation under study.
Dependent Variable: Value changes according to the independent variable.
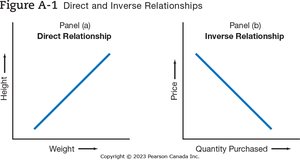
Direct and Inverse Relationships
Variables can be related directly or inversely.
Direct Relationship: Both variables increase or decrease together.
Inverse Relationship: One variable increases while the other decreases.
Constructing a Graph
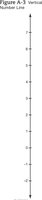
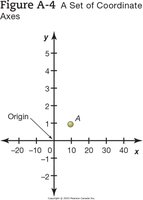
Graphs are constructed using number lines and coordinate axes.
Number Line: Divided into equal segments, each associated with a number.
y axis: Vertical axis.
x axis: Horizontal axis.
Origin: Intersection of y and x axes.

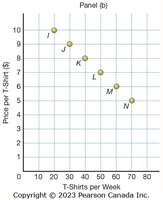
Graphing Numbers in a Table
Data from tables can be plotted as points on a graph to visualize relationships.
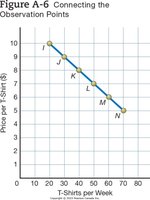
The Slope of a Line (Linear Curve)
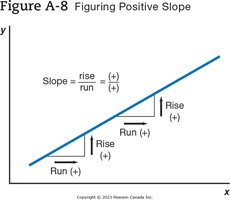
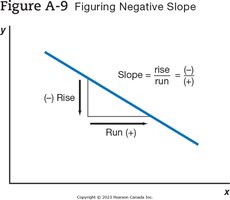
The slope measures the "rise over run" or the change in y divided by the change in x.
Positive Slope: Line rises as it moves right.
Negative Slope: Line falls as it moves right.
Formula:
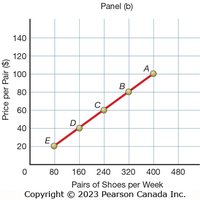
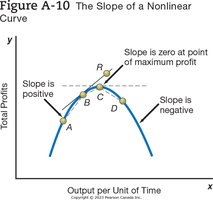
The Slope of a Nonlinear Curve
Nonlinear curves have slopes that change at different points. The slope is positive when the curve rises, negative when it falls, and zero at maximum or minimum points.
Summary of Learning Objectives
Economics: Study of choices to satisfy wants.
Micro vs. Macro: Individual vs. aggregate phenomena.
Basic Questions: What, how, and for whom to produce.
Economic Systems: Centralized vs. decentralized.
Rationality: Self-interest guides decisions.
Science: Models and empirical testing.
Positive vs. Normative: "What is" vs. "What ought to be."
Graphing: Visualizing relationships and slopes.
