 Back
BackComparative Advantage and Gains from International Trade
Study Guide - Smart Notes
 Tailored notes based on your materials, expanded with key definitions, examples, and context.
Comparative Advantage
Definition and Key Concepts
Comparative advantage is a fundamental concept in microeconomics that explains how individuals, firms, or countries can benefit from specializing in the production of goods or services for which they have the lowest opportunity cost, and then trading with others. This principle underpins much of international trade theory.
Comparative Advantage: The ability to produce a good or service at a lower opportunity cost than competitors.
Opportunity Cost: The highest-valued alternative that must be given up to engage in an activity.
Absolute Advantage: The ability to produce more of a good or service than competitors using the same amount of resources.
Example: If China can produce smartphones at a lower opportunity cost than the United States, it has a comparative advantage in smartphones, even if the U.S. has an absolute advantage in both smartphones and wheat.
Opportunity Cost and Trade
Calculating Opportunity Costs
Opportunity cost is central to determining comparative advantage. It is calculated by considering what must be given up to produce one more unit of a good.
For China: Opportunity cost of 1 smartphone = 0.5 bushel of wheat; Opportunity cost of 1 bushel of wheat = 2 smartphones.
For United States: Opportunity cost of 1 smartphone = 2 bushels of wheat; Opportunity cost of 1 bushel of wheat = 0.5 smartphone.
Autarky: A situation in which a country does not trade with other countries. In autarky, relative prices reflect opportunity costs.
Production Possibility Frontier (PPF)
Understanding the PPF
The Production Possibility Frontier (PPF) illustrates the maximum possible output combinations of two goods that a country can produce given its resources and technology. The slope of the PPF reflects opportunity costs and helps visualize the gains from trade.
The PPF is typically bowed outward due to increasing opportunity costs.
Moving along the PPF shows the trade-off between producing one good versus another.
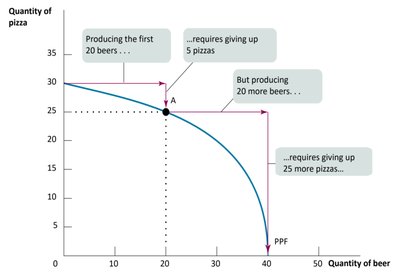
Example: Producing more beer requires giving up increasing amounts of pizza, illustrating increasing opportunity costs.
Gains from Trade
Specialization and Increased Output
When countries specialize in the goods for which they have a comparative advantage and then trade, total production and consumption can increase for all parties involved.
Without trade, each country consumes only what it produces.
With trade, countries specialize and exchange goods, leading to higher overall consumption.
Example: China specializes in smartphones, the U.S. in wheat. After trade, both countries consume more of both goods than they could without trade.
Terms of Trade
Determining Acceptable Exchange Rates
The terms of trade refer to the rate at which one good is exchanged for another between countries. No country will accept terms worse than its opportunity cost.
Terms of trade must be mutually beneficial, falling between the opportunity costs of each country.
Example: Trading 1,500 smartphones for 1,500 bushels of wheat is acceptable to both China and the U.S.
Why Complete Specialization Is Rare
Limitations to Specialization
In reality, complete specialization is uncommon due to several factors:
Not all goods and services can be traded internationally (e.g., medical services).
Increasing opportunity costs mean that some production occurs in multiple countries.
Consumer preferences differ, leading to demand for variety.
Winners and Losers from Trade
Distributional Effects of Trade
While trade increases national welfare, it can negatively impact certain groups:
Some firms and workers may lose due to increased competition (e.g., Chinese wheat farmers, U.S. smartphone workers).
These groups may seek protectionist policies such as tariffs and quotas.
Sources of Comparative Advantage
Factors Influencing Comparative Advantage
Comparative advantage can arise from several sources:
Climate and Natural Resources: Some countries are better suited for certain types of production.
Relative Abundance of Labor and Capital: Differences in workforce skills and infrastructure.
Technological Differences: Variations in technology across countries.
External Economies: Cost reductions from industry expansion.
Worked Example: France and Italy
Opportunity Cost and Specialization
Suppose France and Italy both produce wine and cheese. By calculating opportunity costs, each country can determine which good to specialize in and how to trade for mutual benefit.
France: Opportunity cost of 1 bottle of wine = 1.5 wheels of cheese; Opportunity cost of 1 wheel of cheese = 0.67 bottles of wine.
Italy: Opportunity cost of 1 bottle of wine = 2 wheels of cheese; Opportunity cost of 1 wheel of cheese = 0.5 bottles of wine.
Italy has a comparative advantage in cheese; France in wine.
Example: If Italy trades 2,000 bottles of wine for an acceptable number of wheels of cheese, both countries can consume more than in autarky.
Worked Example: France and Portugal
Opportunity Cost and Gains from Trade
Given output per hour of labor for cloth and wine, calculate opportunity costs, determine comparative advantage, and analyze gains from trade.
France: Opportunity cost of 1 unit of cloth = 0.67 units of wine; Opportunity cost of 1 unit of wine = 1.5 units of cloth.
Portugal: Opportunity cost of 1 unit of cloth = 1.75 units of wine; Opportunity cost of 1 unit of wine = 0.57 units of cloth.
France has a comparative advantage in cloth; Portugal in wine.
Example: After trade, both countries can consume more cloth and wine than in autarky, demonstrating the gains from specialization and exchange.
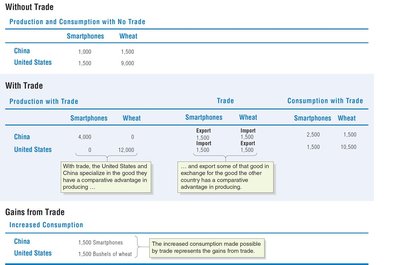
Summary Table: Gains from Trade
Production and Consumption Comparison
The following table summarizes the production and consumption of smartphones and wheat for China and the United States, both with and without trade:
Country | Smartphones (No Trade) | Wheat (No Trade) | Smartphones (With Trade) | Wheat (With Trade) |
|---|---|---|---|---|
China | 1,000 | 1,500 | 2,500 | 1,500 |
United States | 1,500 | 9,000 | 1,500 | 2,500 |
Additional info: The increased consumption made possible by trade represents the gains from trade.
