 Back
BackCompetitive Markets: Theory and Applications (Chapter 9 Study Notes)
Study Guide - Smart Notes
 Tailored notes based on your materials, expanded with key definitions, examples, and context.
Competitive Markets
Market Structure and Firm Behaviour
Market structure refers to the characteristics of a market that influence the behaviour and performance of firms, including the number and size of sellers, the degree of product differentiation, the extent of knowledge about competitors, and the freedom of entry and exit. The main types of market structures are competitive markets, monopolies, monopolistic competition, and oligopolies.
Market power: The ability of a firm to influence the price of its product.
Competitiveness: The degree to which individual firms lack market power.
Competitive market: A market where firms have little or no market power.
In a perfectly competitive market, each firm has zero market power and must accept the price determined by market demand and supply.
Competitive Behaviour vs. Competitive Markets
Competitive behaviour describes how actively firms compete for business, which is not the same as being in a competitive market. For example, MasterCard and Visa engage in competitive behaviour but have market power, while wheat farmers do not actively compete but operate in a highly competitive market.
Firms in perfectly competitive markets are price takers and do not influence market price.
Firms with market power can influence price and may engage in active competition.
The Theory of Perfect Competition
Assumptions of Perfect Competition
Perfect competition is a benchmark for comparing other market structures and applies to many agricultural and raw-materials markets. The four key assumptions are:
All firms sell a homogeneous (identical) product.
Buyers and sellers have perfect knowledge of prices and product characteristics.
Each firm is small relative to the industry (minimum efficient scale is small compared to total industry output).
Freedom of entry and exit for firms in the industry.
These assumptions ensure that each firm is a price taker: it can sell any quantity at the market price but cannot influence that price.
Example: Wheat Market
Each wheat farmer is one of thousands, producing an identical product. No single farmer can influence the market price, and there are no barriers to entry or exit.
Demand Curves in Competitive Markets
Industry vs. Firm Demand Curves
The demand curve for the entire competitive industry is downward sloping, while the demand curve facing an individual firm is perfectly elastic (horizontal) at the market price. This is because any realistic change in one firm's output does not affect the market price.
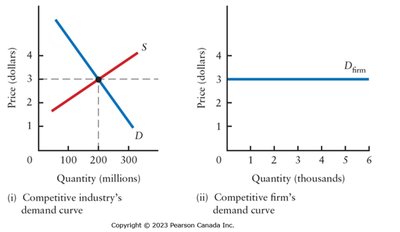
Why Small Firms Are Price Takers
Market demand is downward sloping, so industry output affects price.
One firm's output is too small to affect market price, so the firm faces a horizontal demand curve.
Revenue Concepts for Competitive Firms
Total, Average, and Marginal Revenue
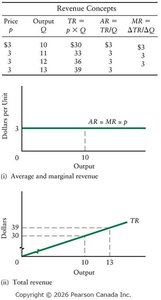
Total Revenue (TR): The total amount received from sales.
Average Revenue (AR): Revenue per unit sold.
Marginal Revenue (MR): Change in total revenue from selling one more unit.
For a price-taking firm,
Short-Run Decisions of Competitive Firms
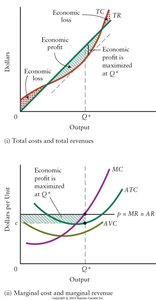
Profit Maximization
The firm's objective is to maximize economic profit ():
If , the firm makes economic losses.
The firm must decide whether to produce or shut down in the short run.
Shut-Down Decision
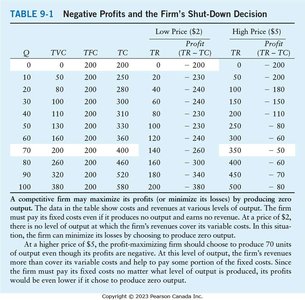
If the firm produces nothing, it loses an amount equal to its fixed costs (). If it produces, it incurs variable costs () and earns revenue (). The firm should produce if there is some output where (or equivalently, ).
If for all output levels, the firm should shut down.
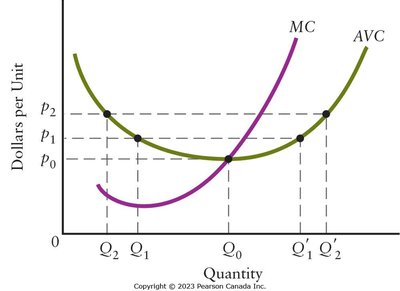
The shut-down price is the minimum of the average variable cost curve:
How Much Should the Firm Produce?
If , increase output to raise profit.
If , decrease output to raise profit.
Profit is maximized where (for a competitive firm, as long as ).
Short-Run Supply Curve
Firm's Supply Curve
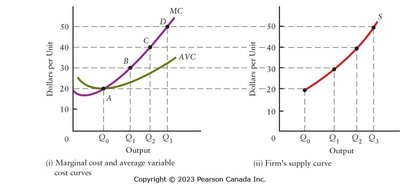
The supply curve of a competitive firm is the portion of its marginal cost (MC) curve that lies above the average variable cost (AVC) curve.
Industry Supply Curve
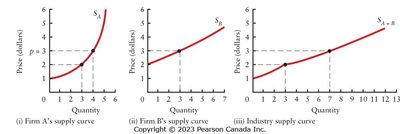
The industry supply curve is the horizontal sum of all firms' supply curves (i.e., the sum of MC curves above AVC for all firms).
Short-Run Equilibrium in a Competitive Market
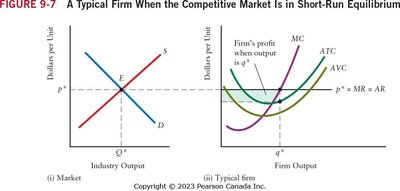
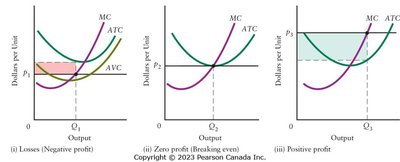
Market price is determined by the intersection of industry supply and demand. Each firm maximizes profit by producing where . In the short run, firms may earn positive profits, break even, or incur losses.
Long-Run Decisions and Equilibrium
Entry and Exit
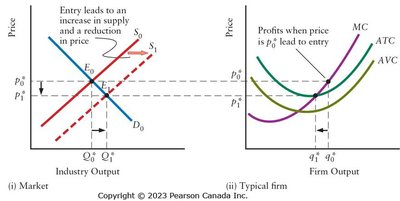
Positive economic profits attract new firms (entry), shifting supply right and lowering price until profits are zero.
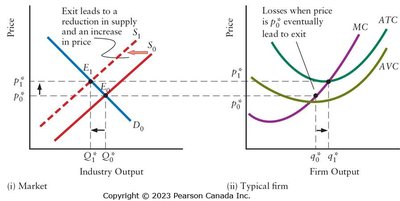
Economic losses cause firms to exit, shifting supply left and raising price until losses are eliminated.
Zero economic profit means no incentive for entry or exit.
Long-Run Equilibrium
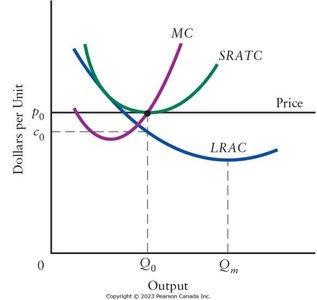
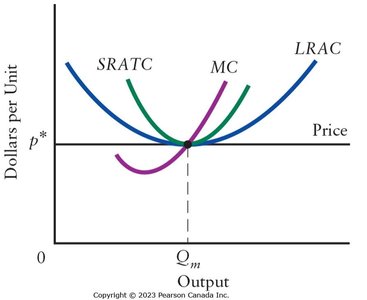
In long-run equilibrium, firms earn zero economic profit, price equals the minimum of average total cost, and there is no incentive for entry or exit. The four conditions for long-run equilibrium are:
Firms maximize profits ().
No losses ().
No profits ().
Firms cannot increase profits by changing plant size (operate at minimum ).
Technological Change and Industry Dynamics
Changes in Technology
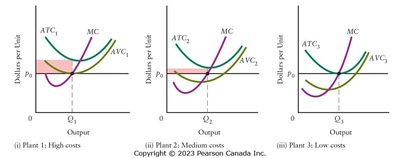
Technological improvements lower costs for new plants, leading to entry and increased industry output. The market price falls until only the most efficient (newest) plants remain, and a new long-run equilibrium is established at a lower price and higher output.
Declining Industries
When demand falls, price drops below average total cost, causing losses and exit. Firms continue to operate as long as price covers variable costs, but industry capacity shrinks over time. Government support for declining industries may delay adjustment; retraining and income support are more effective responses.
Lessons from History: Whaling and Oil Industries
Historical examples show that technological change and substitutes can lead to the decline of once-thriving industries (e.g., whale oil replaced by kerosene, oil facing competition from renewables). Market signals guide the reallocation of resources over time.
